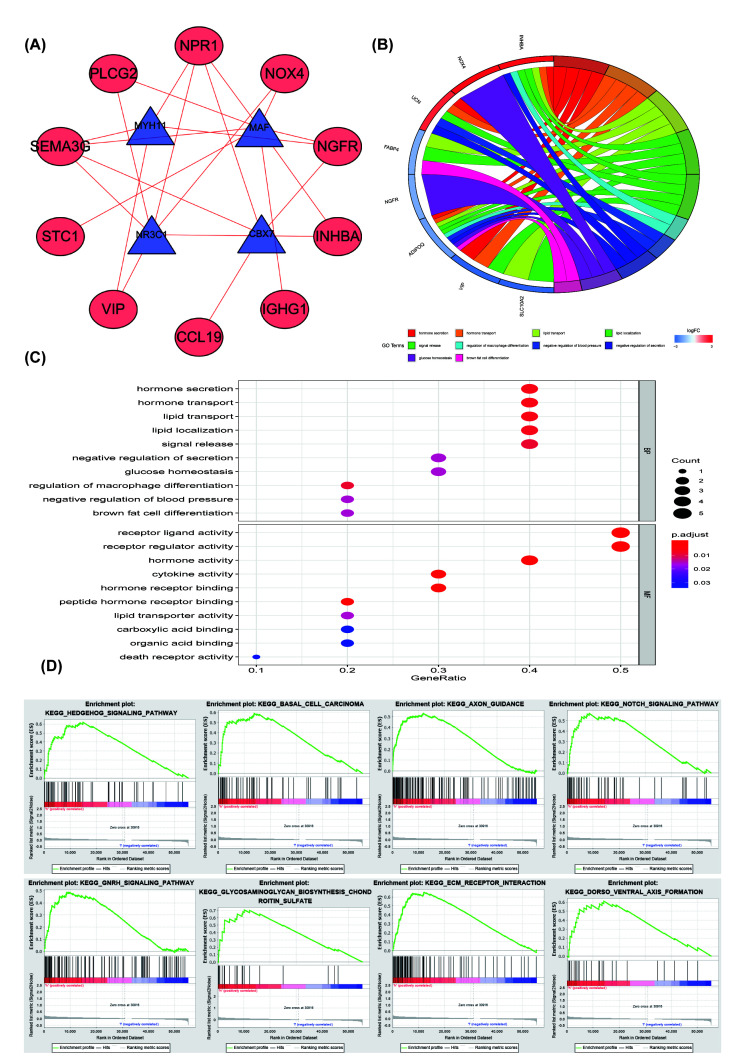
Figure 4. PPI networks and functional enrichment analysis of PRIGs.
(A) PPI networks: the positive interactions (red line), TFs (blue and triangle), high-risk IGs (red and ellipse). (B) GO terms of PRIGs: on the left is the gene, up-regulation was red and down-regulation was blue, on the right was a different GO term, and the genes were linked via ribbons to their assigned terms (P<0.05). (C) The TOP-10 terms of BP and MF. (D) GSEA analysis of the differentially expressed genes in the high-risk group. PRIGs, prognosis-related immune genes; PPI, Protein-Protein interaction;GO, Gene Ontology; BP, biological processes; MF, molecular functions;GSEA,Gene Set Enrichment Analysis.

