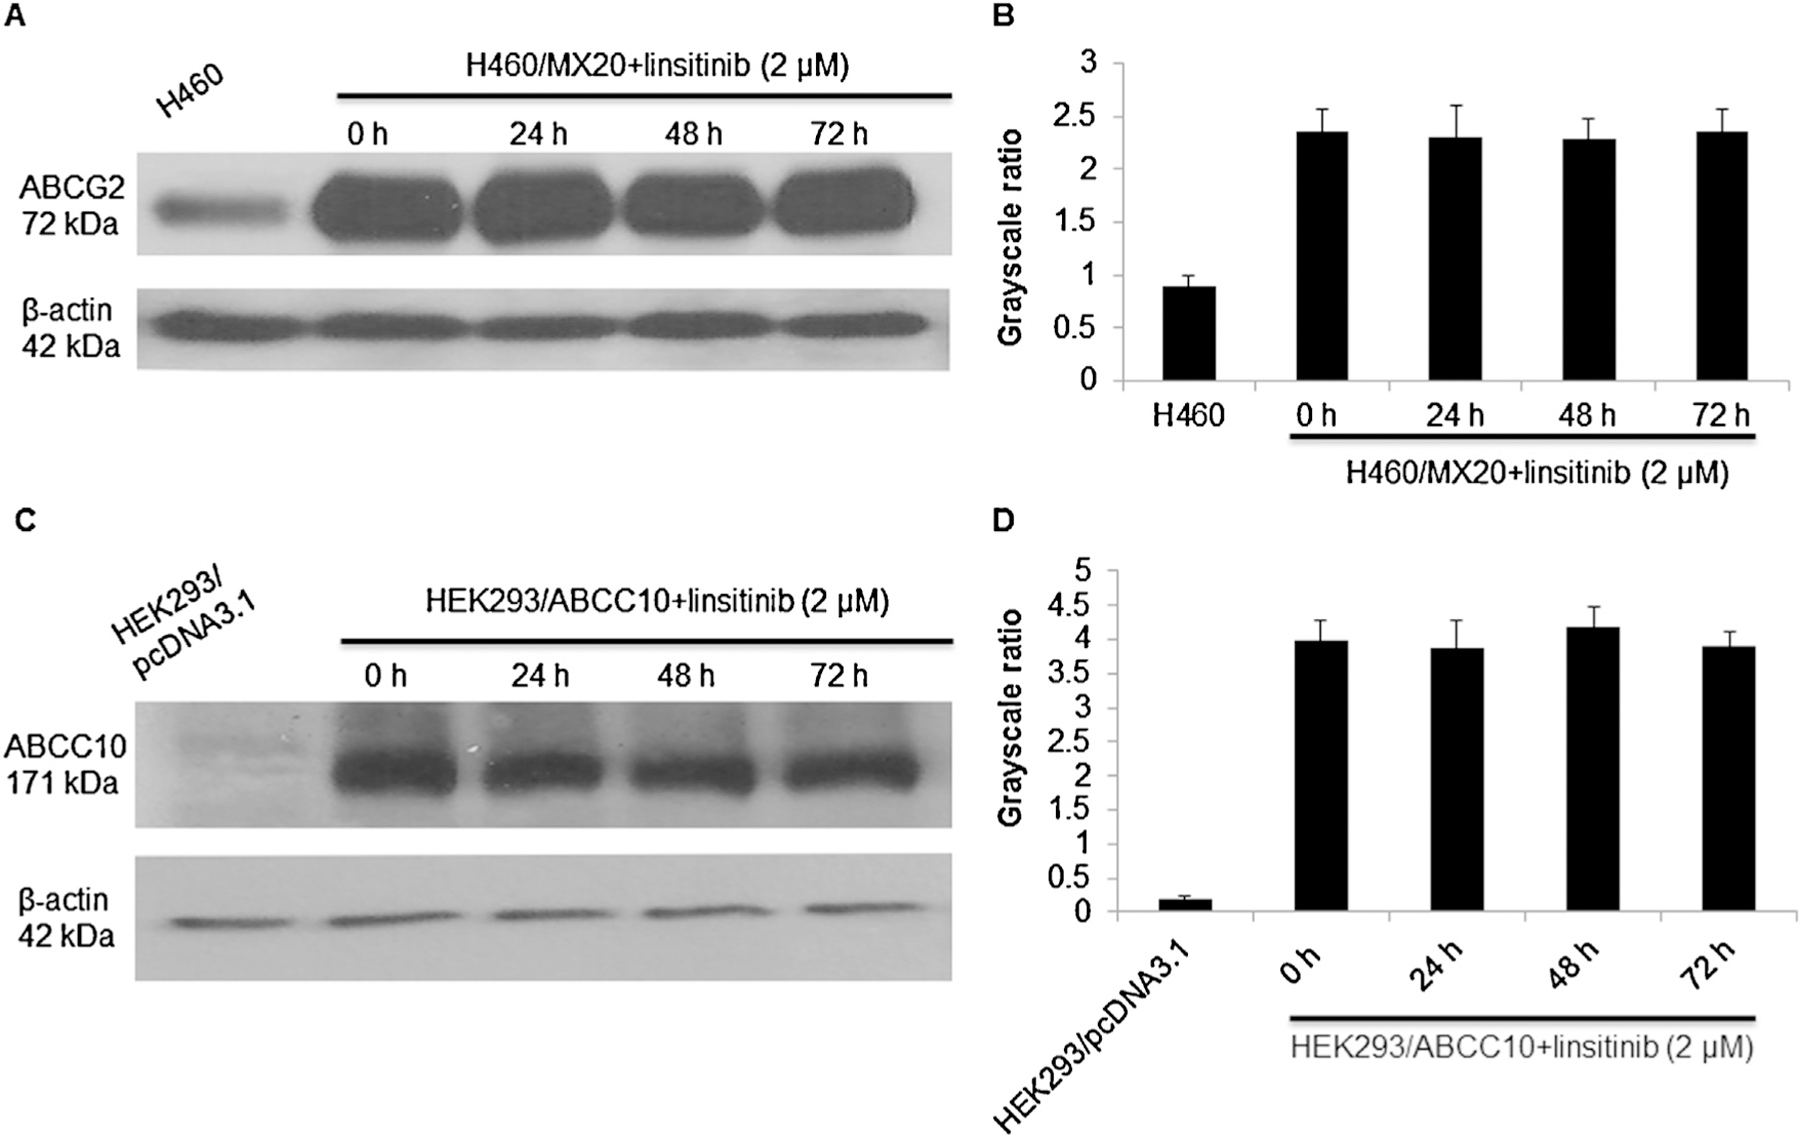
Fig. 4.

The effect of linsitinib on the expression levels of ABCG2 and ABCC10 transporters, respectively. (A and B) The expression levels of ABCG2 protein in H460 and H460/MX20 cell lysates were shown. (C and D) The expression levels of ABCC10 protein in HEK293/pcDNA3.1 and HEK293/ABCC10 cell lysates were shown. Image J was used to analyze the grayscale ratios. The grayscale ratios were proportional to the ABCG2 or ABCC10 protein levels. The differences were statistically non-significant (p > 0.05). A representative result was shown and similar results were obtained in two other experiments.
