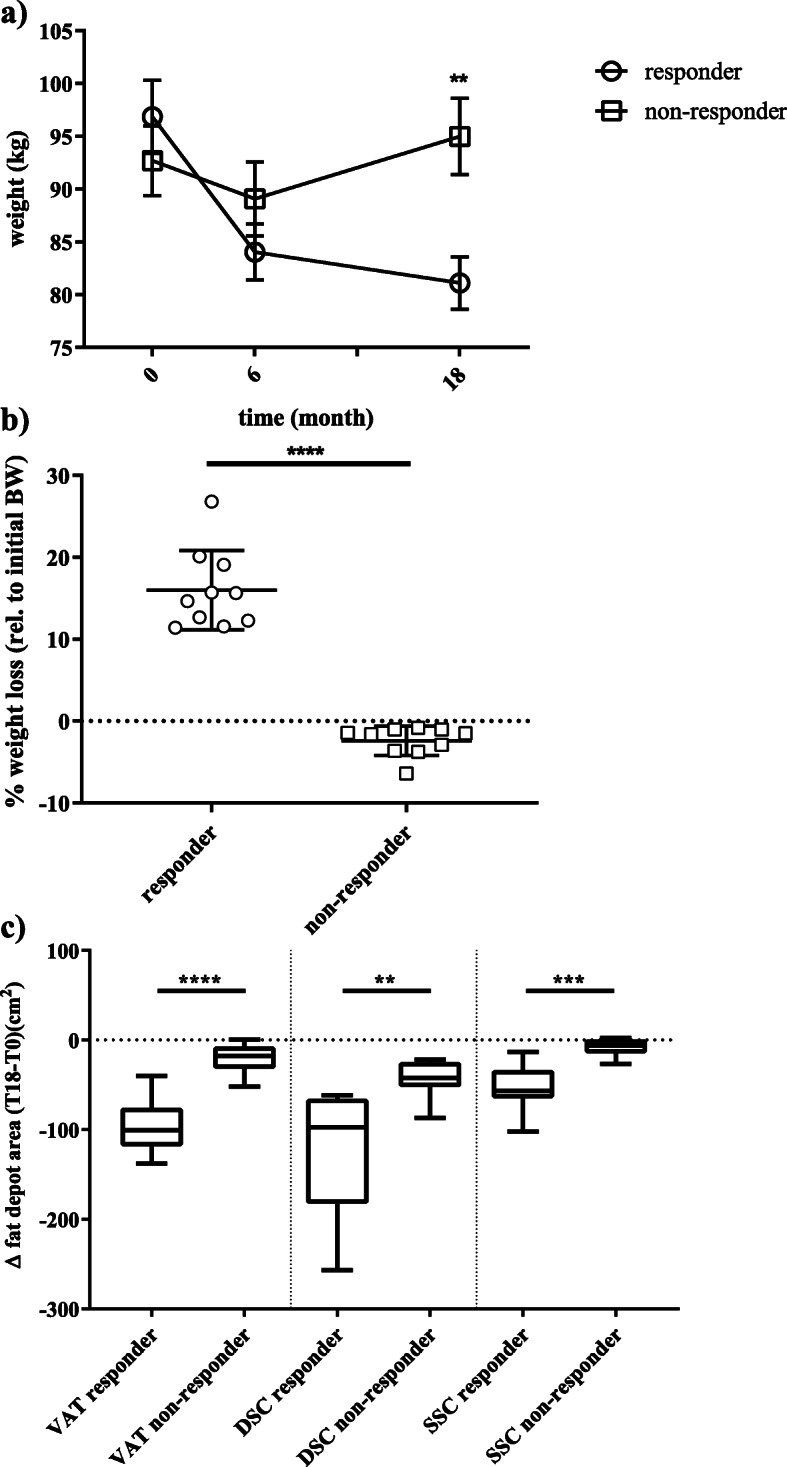
Fig. 2.

Phenotypic differences between responders and non-responders to a lifestyle intervention. a shows the absolute weight of the responders (N = 10) and non-responders (N = 10) subgroups over the three time points: baseline (T0), 6 months (T6), and 18 months (T18). Data is shown as mean ± SD; b shows the relative (%, rel. to T0) weight-loss at 18 months for both subgroups. Data is shown as scatter dot plots (mean ± SD); c shows the absolute changes of fat areas (cm2; VAT-visceral AT, DSC-deep subcutaneous AT, SCC- superficial subcutaneous AT) at 18 months compared to the baseline area as boxplots (line = median) with whiskers representing min and max values; **P < 0.001; ***P < 1 × 10⁻³; ****P < 1 × 10⁻⁴
