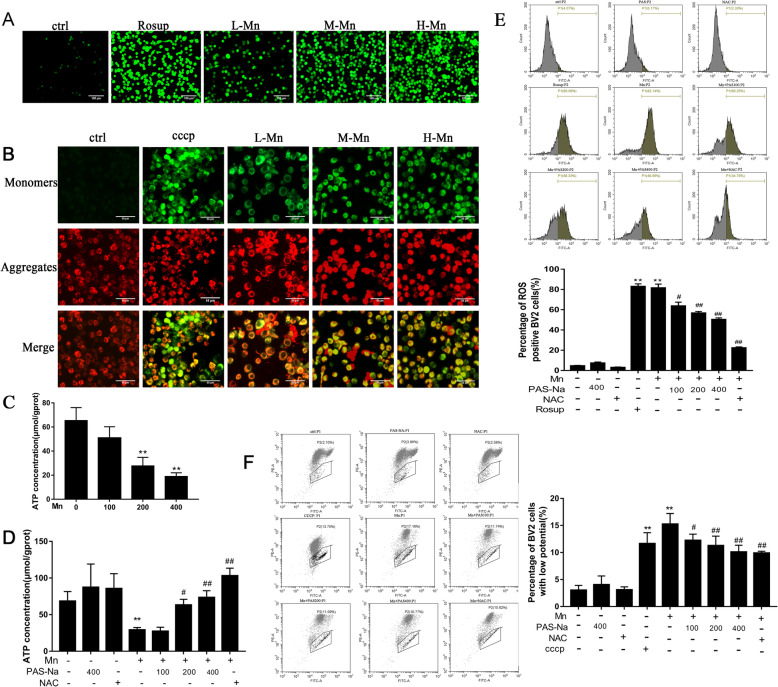
Fig. 2.
PAS-Na inhibited Mn-induced oxidative stress in BV2 cells. a–c BV2 cells were treated with 100, 200, and 400 μmol/L MnCl2 for 24 h, respectively. Cells in positive control group were treated with rosup or CCCP (a, e) (a compound mixture that was provided by the manufacturer) for 1 h after normal medium cultured for 23 h. a ROS in BV2 cells was detected by DCFH-DA kit. After DCFH-DA treatment, ROS shows green fluorescence. Scale bars: 100 μm. b Mt∆Ψm of BV2 cells was determined by the lipophilic cationic probe JC-1. When the mt∆Ψm is high, JC-1 gathers in the mitochondrial matrix to form J-aggregates and produces red fluorescence. On the contrary, JC-1 is presented as a monomer and produces green fluorescence. Scale bars: 50 μm. c Mn decreased intracellular ATP concentration in BV2 cells. d–f BV2 cells were treated with 200 μmol/L MnCl2 for 24 h, following treatment with 100, 200, and 400 μmol/L PAS-Na and 50 umol/L NAC for 24 h, respectively. d PAS-Na recovered the ATP levels in Mn-treated BV2 cells. e Flow cytometry analysis of intracellular ROS in BV2 cells. f Flow cytometry analysis of intracellular the mt∆Ψm change of BV2 cells. All tests were repeated independently three times. Data are presented as mean ± SD. *p < 0.05 and **p < 0.01: significant as compared to the control group; #p < 0.05 and ##p < 0.01: significant as compared to Mn-treated group

