
FIGURE 1.
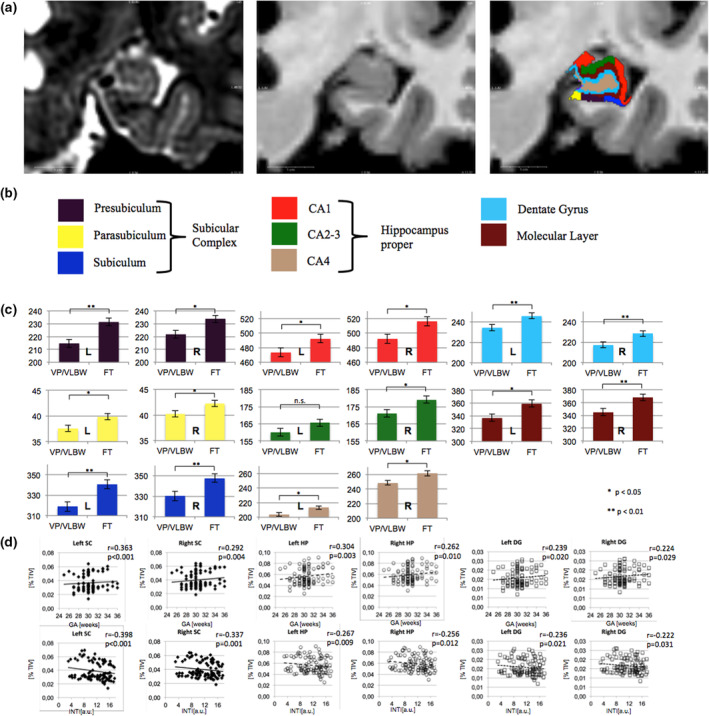
(a) Hippocampus subfield segmentation. Exemplary hippocampus subfield (HCSF) parcellation and labeling as produced by FreeSurfer v6.0 for a given individual's T2‐ and T1‐weighted input images are shown and depicted by a color legend (see below). Coronal slice inputs for the multispectral analysis are shown (left panel: T2‐weighted, middle panel: T1‐weighted). (b) Functional hippocampus units were formed as indicated: SC consisting of presubiculum, parasubiculum and subiculum and HP consisting of CA1‐4. (c) Lower hippocampus subfields in premature born adults. Marginal means of bilateral HCSF are shown as bar plots, error bars indicate SE. Group differences were assessed using a general linear model (fixed factor: prematurity at birth, covariates: sex, scanner, TIV). Colors correspond to the labels in Panel (a). Significant group differences after false discovery correction for multiple comparisons using the Benjamini–Hochberg method are marked with asterisks (*: p < .05; **: p < .01). (d) Associations between functional hippocampus units and variables of premature birth. Scatterplots of associations of left and right SC, HP, and DG are shown with GA (upper row) and intensity of neonatal treatment (INTI, lower row) are shown as scatterplots. Linear regression lines and regression coefficients of partial regression analyses are added. Functional hippocampus unit volumes are depicted as percentage of TIV. a.u., arbitrary units; CA, cornu ammonis; DG, dentate gyrus; FT, full‐term; GA, gestational age; HP, hippocampus proper; INTI, intensity of neonatal treatment; mm3, cubic millimeter; SC, subicular complex; TIV, total intracranial volume; VP/VLBW, very preterm and/or very low birthweight