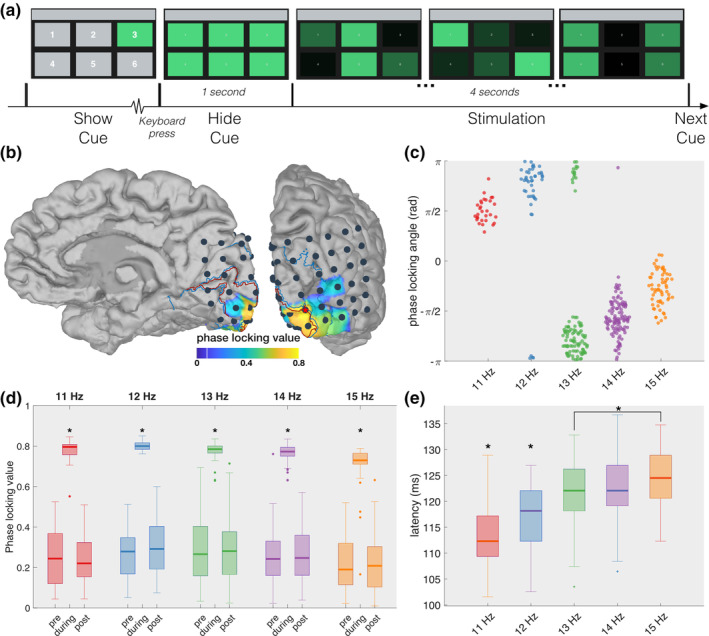
FIGURE 1.

Phase locking to stimulation. (a) Graphical rendition of the visual stimulation presented during one trial. Note that the target numbers in the left‐most panel are enlarged for better visualisation and do not correspond to their actual size. (b) Average phase locking value (PLV) of the fundamental response during the stimulation for each subdural channel. High PLVs are localised to the posterior part of the primary visual cortex. To declutter the plot, only the cortical areas that exhibit a significant increase in PLV compared to pre‐ and post‐stimulation are indicated with a colour. The red and blue outlines on the cortex indicate V1 and V2, respectively, while the black dots mark the 48 recording sites. The electrode indicated with a red star exhibits the strongest average phase locking. (c) For the starred electrode, the phase locking angles of individual trials, indicated by individual dots, are highly similar and show an upward trend for increasing frequency. (d) Boxplots showing that the starred electrode synchronises to the stimulation for every frequency and returns to baseline when the stimulation ends. (e) The latency of the fundamental component shows an increasing trend for increasing frequency. Stars indicate significant differences
