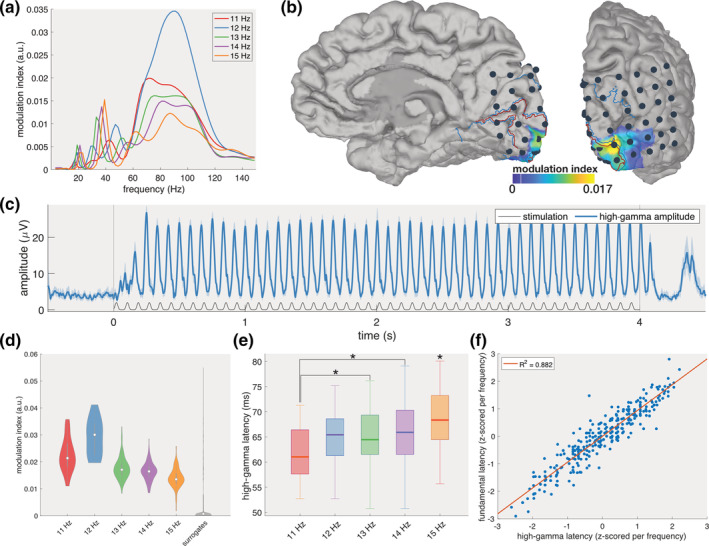
FIGURE 2.

High‐gamma amplitude. (a) Modulograms showing the modulation index (i.e., coupling strength) between the phase of the gazed stimulation and the amplitude of the neural response at frequencies below 150 Hz at electrode 36. (b) Spatial distribution of the modulation index between the phase of the stimulation and the amplitude of the high‐gamma response. (c) Averaged high‐gamma amplitude in the temporal domain when gazing at the 12 Hz zero‐phase target. The full blue line indicates the amplitude in the high‐gamma band and the surrounding shaded areas the 95% confidence interval. The thin black line indicates the gazed stimulation profile. (d) The modulation index for each of the five frequencies adopted in this study and of a surrogate group. (e) The latency of the high‐gamma response exhibits a positive trend towards higher temporal frequencies. Stars indicate significant differences. (f) Linear regression between the high‐gamma latency and the fundamental latency reveals a strong relationship between both latencies
