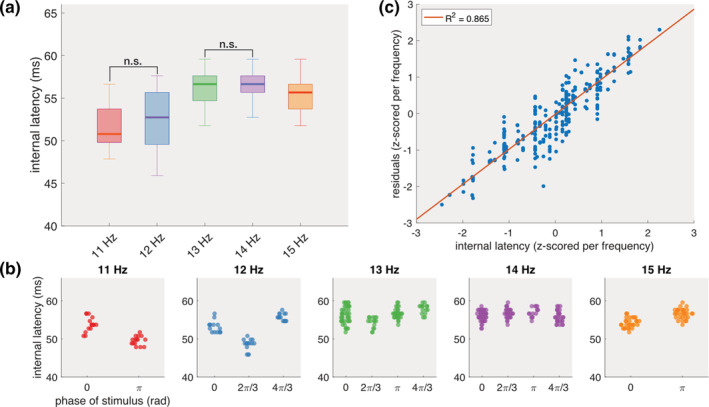
FIGURE 3.

Internal latency. (a) The latency between the peaks of the high‐gamma amplitude and fundamental response. (b) When grouped per unique frequency‐phase combination, distinct clusters are revealed for the 11 and 12 Hz frequencies. Each dot indicates one trial. (c) Regression between the internal latencies and the residuals from Figure 2f. Each dot indicates one trial
