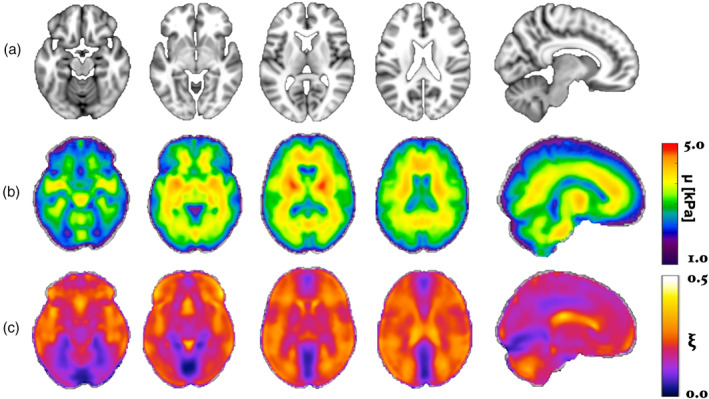
FIGURE 2.

(a) Representative axial images and sagittal view (last column) from the MNI152 T1‐weighted template; (b) mean shear stiffness, μ mean, and (c) mean damping ratio, ξmean, templates created by averaging the spatially normalized images from all 134 participants
