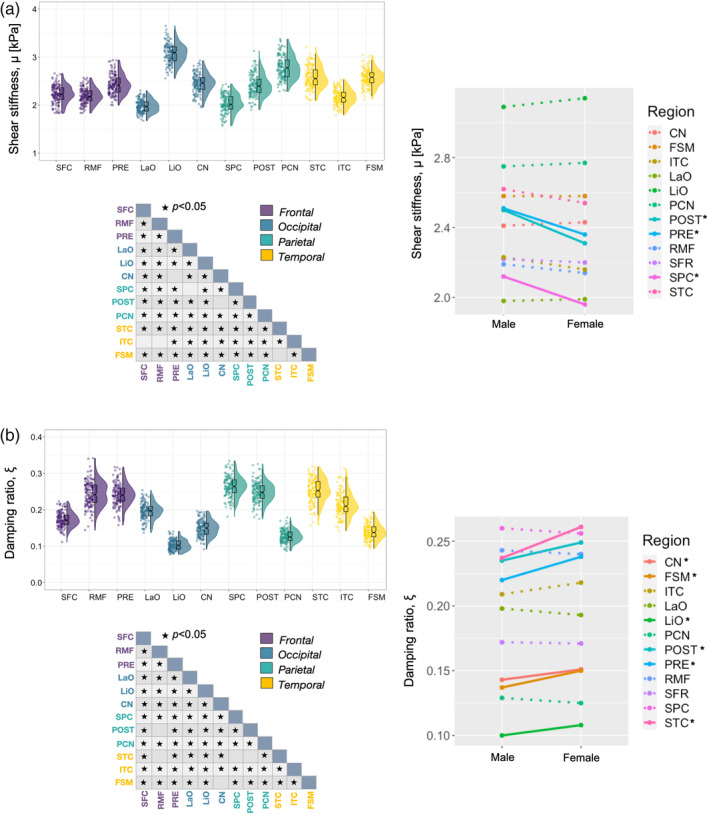
FIGURE 6.

Variable density boxplots, pairwise significant charts, and sex x region interaction plots for cortical gray matter (a) shear stiffness, μ, and (b) damping ratio, ξ. The length of the box plots illustrates the 25th and 75th percentiles (i.e., interquartile range), with the central black line showing the median. Extended lines indicate the maximum and minimum values. Individual data points have been adjusted for study and sex by removing the relevant estimated coefficients from the mixed model. Significant differences between structures were determined through post‐hoc linear correlations which were adjusted for multiple comparisons with Bonferroni correction. A significant interaction was found between sex and CGM μ, with the postcentral cortex (POST; p < .001), precuneus (PCN; p < .001), and superior parietal cortex (SPC; p < .001) being stiffer in males. A significant interaction was also found for ξ; females had greater ξ for cuneus (CN; p = .046), fusiform (FSM; p = .007), lingual occipital (LiO; p = .010), precentral (PRE; p = .014), postcentral (POST; p = .025), and superior temporal (STC; p = .005) cortices
