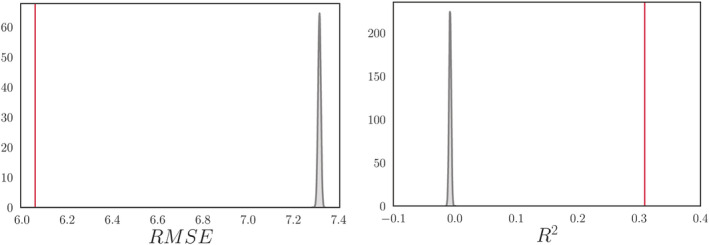
FIGURE 1.

Average root mean square error (RMSE) and R 2 compared to null distributions. Left: The mean ± SD RMSE was 6.06 ± 0.09, based on a 10‐fold cross validation with 10 repetitions per fold (red vertical line). The null distribution calculated from 10,000 permutations is shown in gray, with a mean ± SD of 7.32 ± 0.006. The number of permuted results from the null distribution that exceeded the mean from the cross validation was 0 (p = 1.00 × 10⁻⁴). Right: The mean ± SD R2 for the brain age model was 0.31 ± 0.09 (red vertical line). The null distribution calculated from 10,000 permutations is shown in gray, with a mean ± SD of −0.007 ± 0.002 (p = 1.00 × 10⁻⁴)
