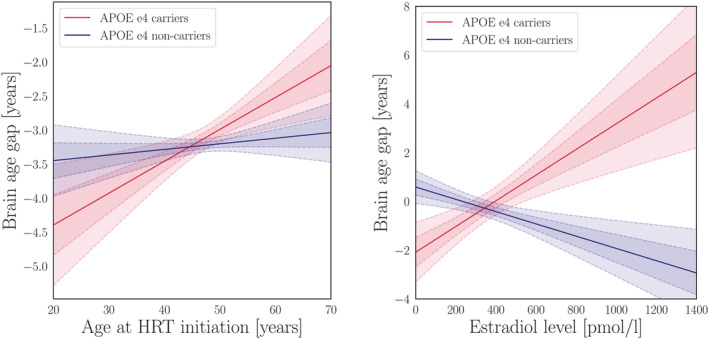
FIGURE 3.

Apolipoprotein E (APOE) genotype interactions. Left plot: The lines show the association (β) between age started hormone replacement therapy (HRT) and apparent brain aging for the APOE e4 carriers (red) and non‐carriers (blue). The fitted values are corrected for the covariates in the model (age, number of births, had hysterectomy, and/or oophorectomy). Right plot: The lines show the association between estradiol levels and apparent brain aging for the APOE e4 carriers (red) and non‐carriers (blue). The fitted values are corrected for the covariates in the model (age, number of births, current HRT use, ever used HRT, length since menopause, age at first birth, and education). The shaded areas show the 68.3% (1 SD) and 95% (2 SD) confidence intervals for each fit
