
FIGURE 2.
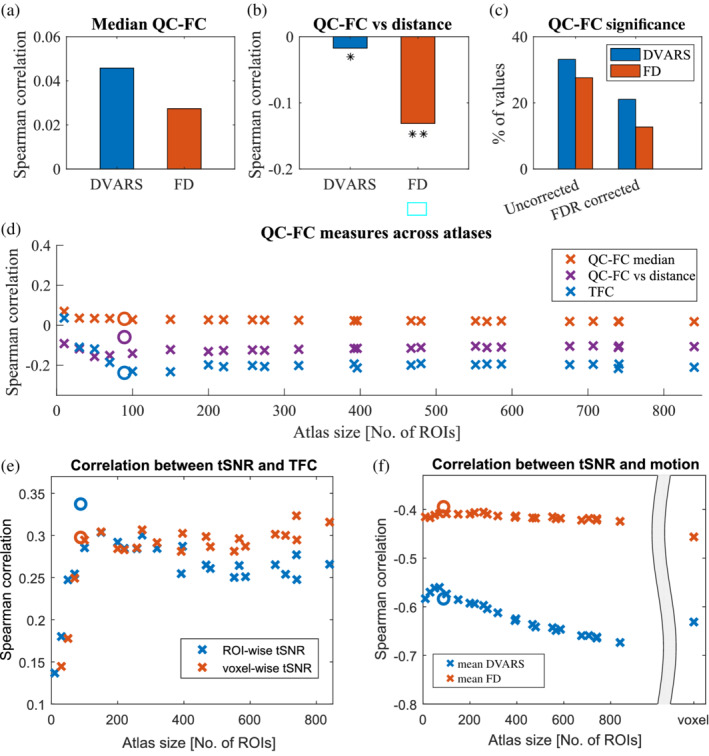
Comparison of TFC with other measures of FC and data quality. (a) The QC‐FC correlations quantify the association between inter‐individual variance in functional connectivity and gross head motion. A positive median of QC‐FC values signifies that head motion increases connectivity (for both FD and DVARS). (b) This effect is more prominent for short‐links and it is more specifically related to motion as correlations are stronger when FD models quality controls. *signifies p < .05, ** p < .001 (c) On the other hand, the amount of edges that are significantly affected by movements is more easily detectable with DVARS. (d) Above mentioned effects are stable across atlases with different number of ROIs. Magnitudes of TFC correlations are higher than the median of DVARS‐FC, proving its viability as an estimator. Plotted only for mean DVARS but results with FD are similar. A circle mark indicates AAL atlas. (e) tSNR measures different data aspects than TFC as the correlation is weak. Nevertheless, it is significant and positive. (f) With decreasing size of ROIs, the relationship between tSNR and mean DVARS gets stronger. This trend is not present for FD, suggesting that the phenomenon is potentially caused by other types of noise than a head movement