
FIGURE 2.
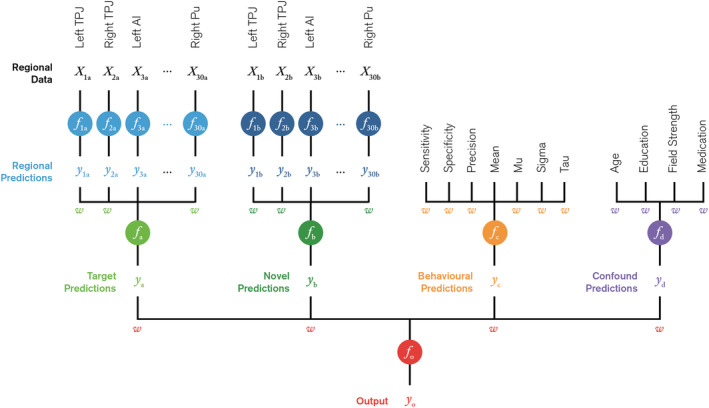
Schematic of machine learning framework. In Stage 1, a set of experts (blue) are independently trained on a subset of fMRI data extracted from one of 30 regions and one of two experimental conditions; target, (a), and novel, (b). In Stage 2, the region‐based predictions, y 1–30a and y 1–30b, are then fused to obtain conditional predictions, y a and y b (green). Experts are also trained on the behavioural (orange) and confound (purple) feature sets. In Stage 3, the conditional, behavioural and confound predictions, y a–d, are fused to form a final output prediction, y o (red). Each fusion model assigns a set of weights, w, to each feature set which is used to intuit the relative feature importance in making predictions