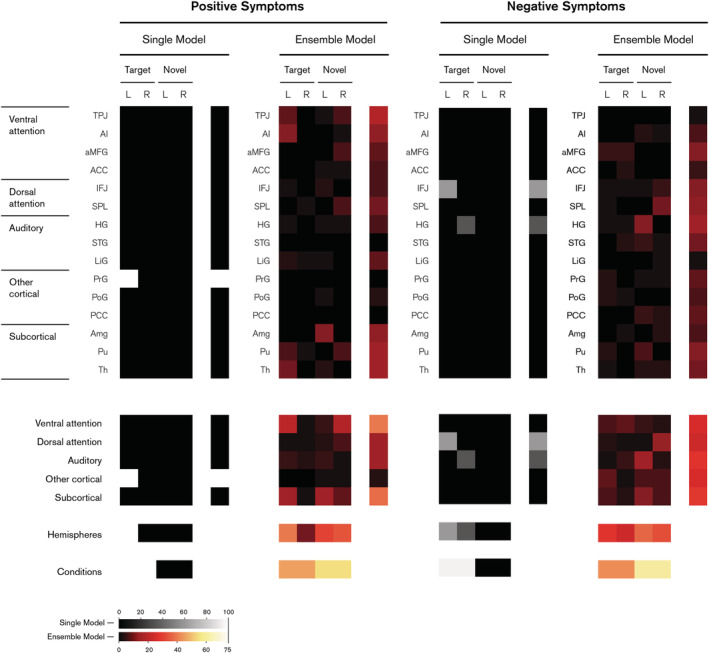
FIGURE 6.

Feature importance for SAPS and SANS summary score models. Ensemble models are shown in warm colour map and single models shown in greyscale. Regional weight maps (top panel) show the relevance of each region (rows) in both left (L) and right (R) hemispheres under target and novel conditions (columns). Categorical weight maps (bottom panel) show the net contribution of each system, hemisphere and condition towards model predictions. Categorical groups of regions are based on Kim (2014). Colours denote the contribution of each feature towards predictions as a percentage, with black indicating an entire feature set has been marked as irrelevant by the lasso algorithm
