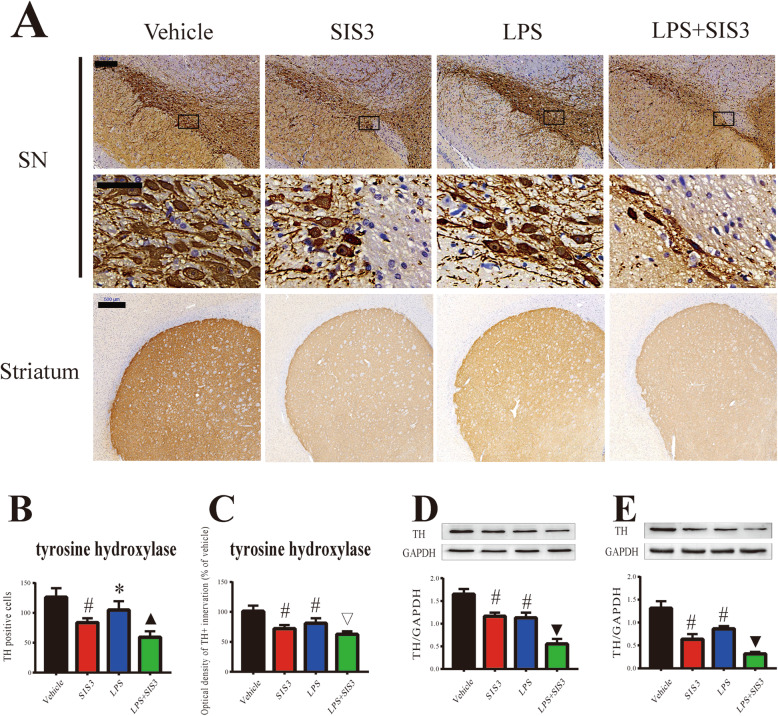
Fig. 2.
Effect of SIS3 and LPS on nigrostriatal dopaminergic system in rats. a Representative figures of TH expression (immunohistochemistry) in the SN and striatum. Scale bar = 200 μm in the SN (upper panels); 50 μm in the SN (below panels); and 500 μm in the striatum. b Quantification of TH+ neuron number in the SN is shown. c Quantification of TH+ innervations in the striatum is shown. d Protein level of TH in the SN was detected by western blotting and its quantitative analysis. e Protein level of TH in the striatum was detected by western blotting and its quantitative analysis. The results are expressed as mean ± SEM. N = 6. *p < 0.05, compared with the rats treated with vehicle; #p < 0.01, compared with the rats treated with vehicle; ▽p < 0.01, compared with the rats treated with vehicle or LPS; ▲p < 0.05, compared with the rats treated with vehicle, SIS3, or LPS; ▼p < 0.01, compared with the rats treated with vehicle, SIS3, or LPS. LPS, lipopolysaccharide (1 mg/kg); SIS3 (4 μg/each side)

