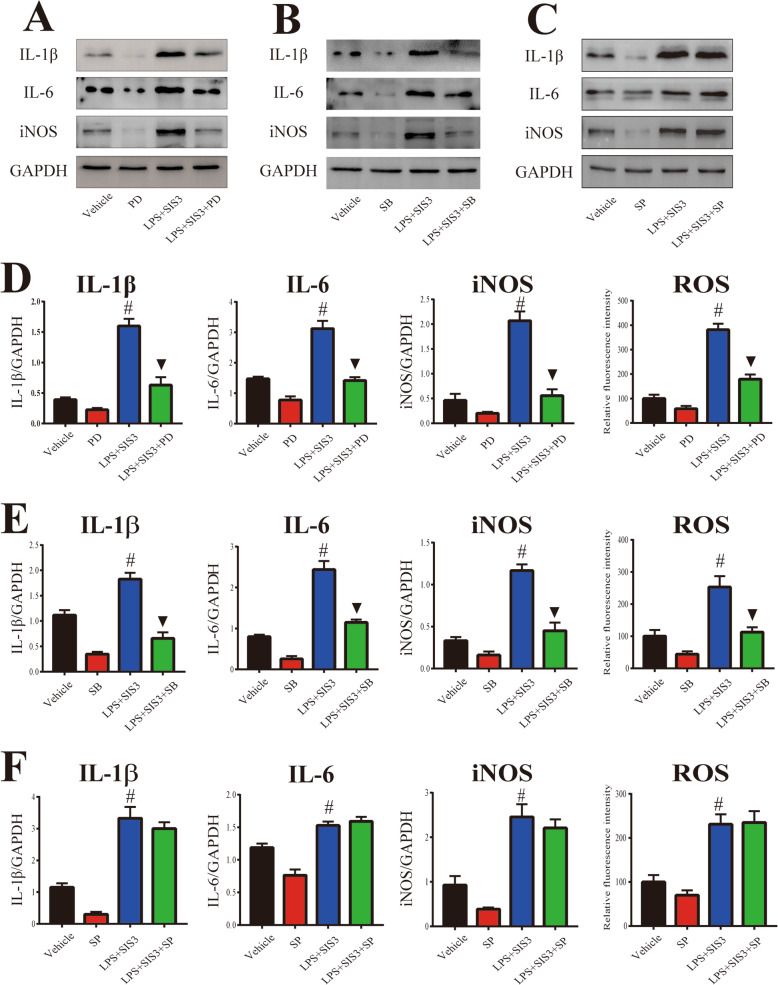
Fig. 7.
Role of MAPK pathways in microglial inflammatory response induced by SIS3 and LPS co-treatment. a–c Representative figures of proinflammatory factor expression (western blotting) in microglia cultures pretreated with PD (a), SB (b), and SP (c). d–e Histogram represents quantitation of IL-1β, IL-6, and iNOS normalized to corresponding GAPDH. ROS production was determined with DCFHDA. It was particularly important to add TGF-β1 to all groups. Results are expressed as mean ± SEM. N = 6. #p < 0.01, compared with the cultures treated with vehicle; ▼p < 0.01, compared with the cultures co-treated with SIS3 and LPS. LPS, lipopolysaccharide (300 ng/ml); SIS3 (10 μM); PD, PD980599, ERK inhibitor (10 μM); SB, SB203580, p38 inhibitor (10 μM). SP, SP600125, JNK inhibitor (10 μM)

