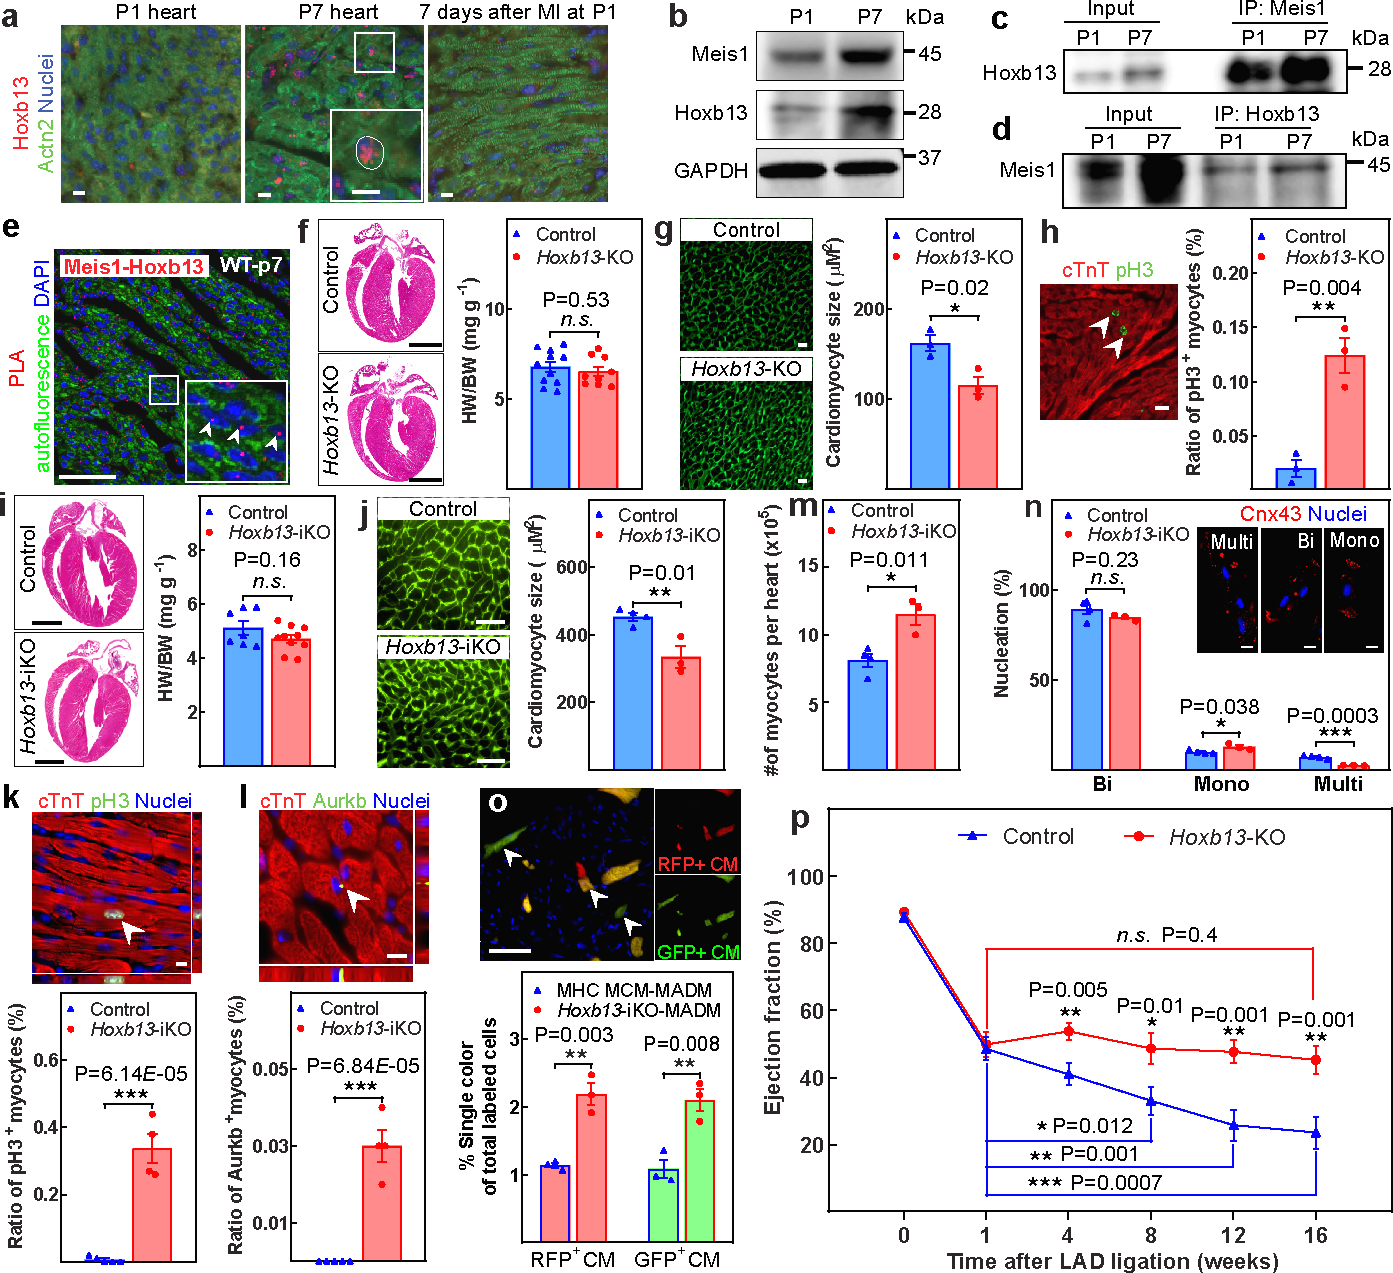
Figure 1: Identification of Hoxb13 as a Meis1-interacting transcription factor in postnatal cardiomyocytes.

a, Immunostaining of Hoxb13 (red), sarcomeric-α-actinin (Actn2; green) and nucleus (blue) at P1, P7 and seven days after P1 MI. The inset shows a higher magnification of the outlined region. b, Western blot analysis of Meis1 and Hoxb13 proteins during regenerative stages. c, d, Coimmunoprecipitation (IP) using Meis1 (c) and Hoxb13 (d) antibodies from total heart extracts at P1 and P7. e, PLA of Meis1-Hoxb13 (red dots) in P7 heart. f, Haematoxylin and eosin-stained heart sections and heart weight/body weight (HW/BW) in Hoxb13-KO mice at P14. g, Wheat germ agglutinin (WGA) staining and CSA quantification in Hoxb13-KO hearts. h, Immunostaining for PH3 (green) and cardiac troponin T (cTnT, red) showing the percentage of mitotic cardiomyocytes (arrowheads). i–n, Quantification of Hoxb13-iKO hearts at 14 days after deletion. i, Heart weight/body weight and H&E-stained heart sections. j, WGA staining and CSA quantification. k, l, Immunostaining for PH3 or aurora B kinase (AurkB) (green), cardiac troponin T (red) and nucleus (blue), showing the percentage of mitotic (k) and cytokinetic (l) cardiomyocytes. m, n, Total number (m) and nucleation (n) of isolated cardiomyocytes. Cx43, connexin 43. o, Representative immunofluorescence and quantification of single-labelled (red or green, arrowheads) cardiomyocytes (CM) in Hoxb13-iKO MADM mice. p, Serial echocardiographic measurements of control and Hoxb13-KO MI mice. Data are mean ± s.e.m.; unpaired two-sided t-test. Data in a–e were independently repeated three times with similar results. *P < 0.05, **P < 0.01, ***P < 0.001. NS, not significant. For gel source data, see Supplementary Fig. 1. For sample numbers, see Methods. Scale bars, 10 μm (a, g, h, k, l, n), 50 μm (e, j, o), 1 mm (f, i). See also Extended Data Figs. 1, 2.
