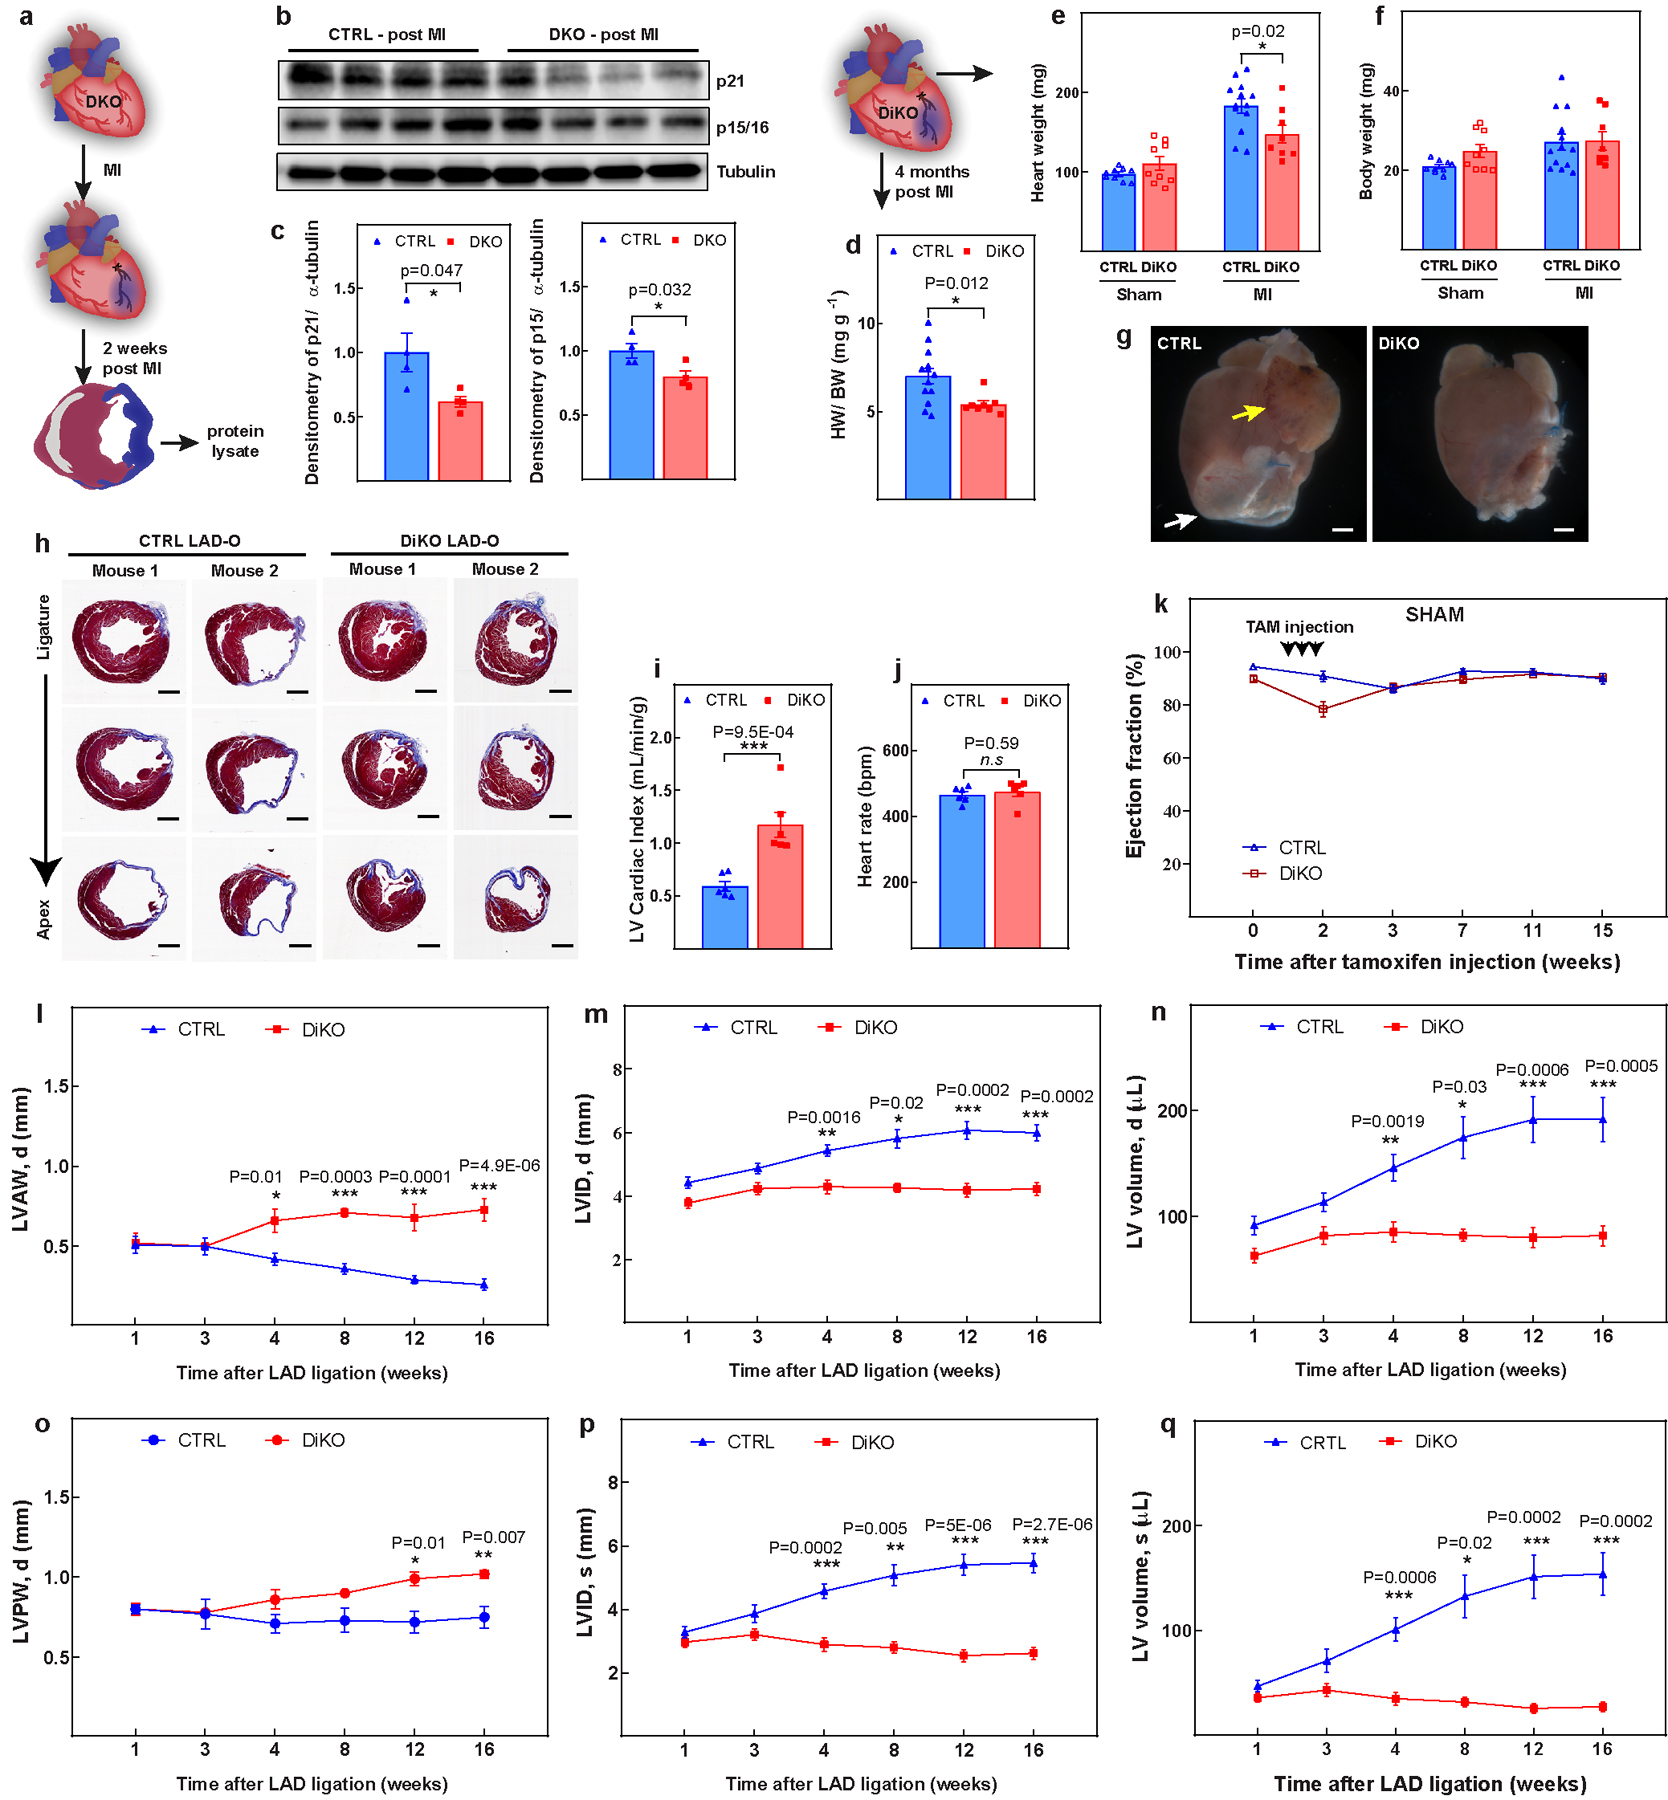
Extended Data Fig. 6. LV function of DKO hearts after MI.

a, Schematic of MI model in DKO hearts 2 weeks post-MI. b, c, Western blot analysis (b) and quantification (c), showing decrease in expression of p21, p15/p16 in DKO hearts. d–f, Heart weight/body weight (d), heart weight (e) and body weight (f) in control and DiKO mice 16 weeks after injury. g, Representative images of the whole hearts at 16 weeks post-MI. The white arrow indicates a region with cell death and the yellow arrow indicates the dilated left atrial appendage. h, Additional representative serial Masson’s trichrome-stained transversal sections, as in Fig. 2l. i, j, LV cardiac index (i) and heart rate (j) in DiKO mice 16 weeks after MI measured by MRI. k, LVEF for sham groups. l–q, Cardiac function analysis for left-ventricular end-diastolic anterior wall thickness (l), left-ventricular end-diastolic internal diameter (m), left-ventricular end-diastolic volume (n), left-ventricular end-diastolic posterior wall thickness (o), left-ventricular end-systolic internal diameter (p), and left ventricular end-systolic volume (q) in DiKO and control mice after MI. Data are mean ± s.e.m.; unpaired two-sided t-test. *P < 0.05, **P < 0.01, ***P < 0.001. For gel source data, see Supplementary Fig. 1. For n values, see Methods. Scale bars, 1 mm (g, h).
