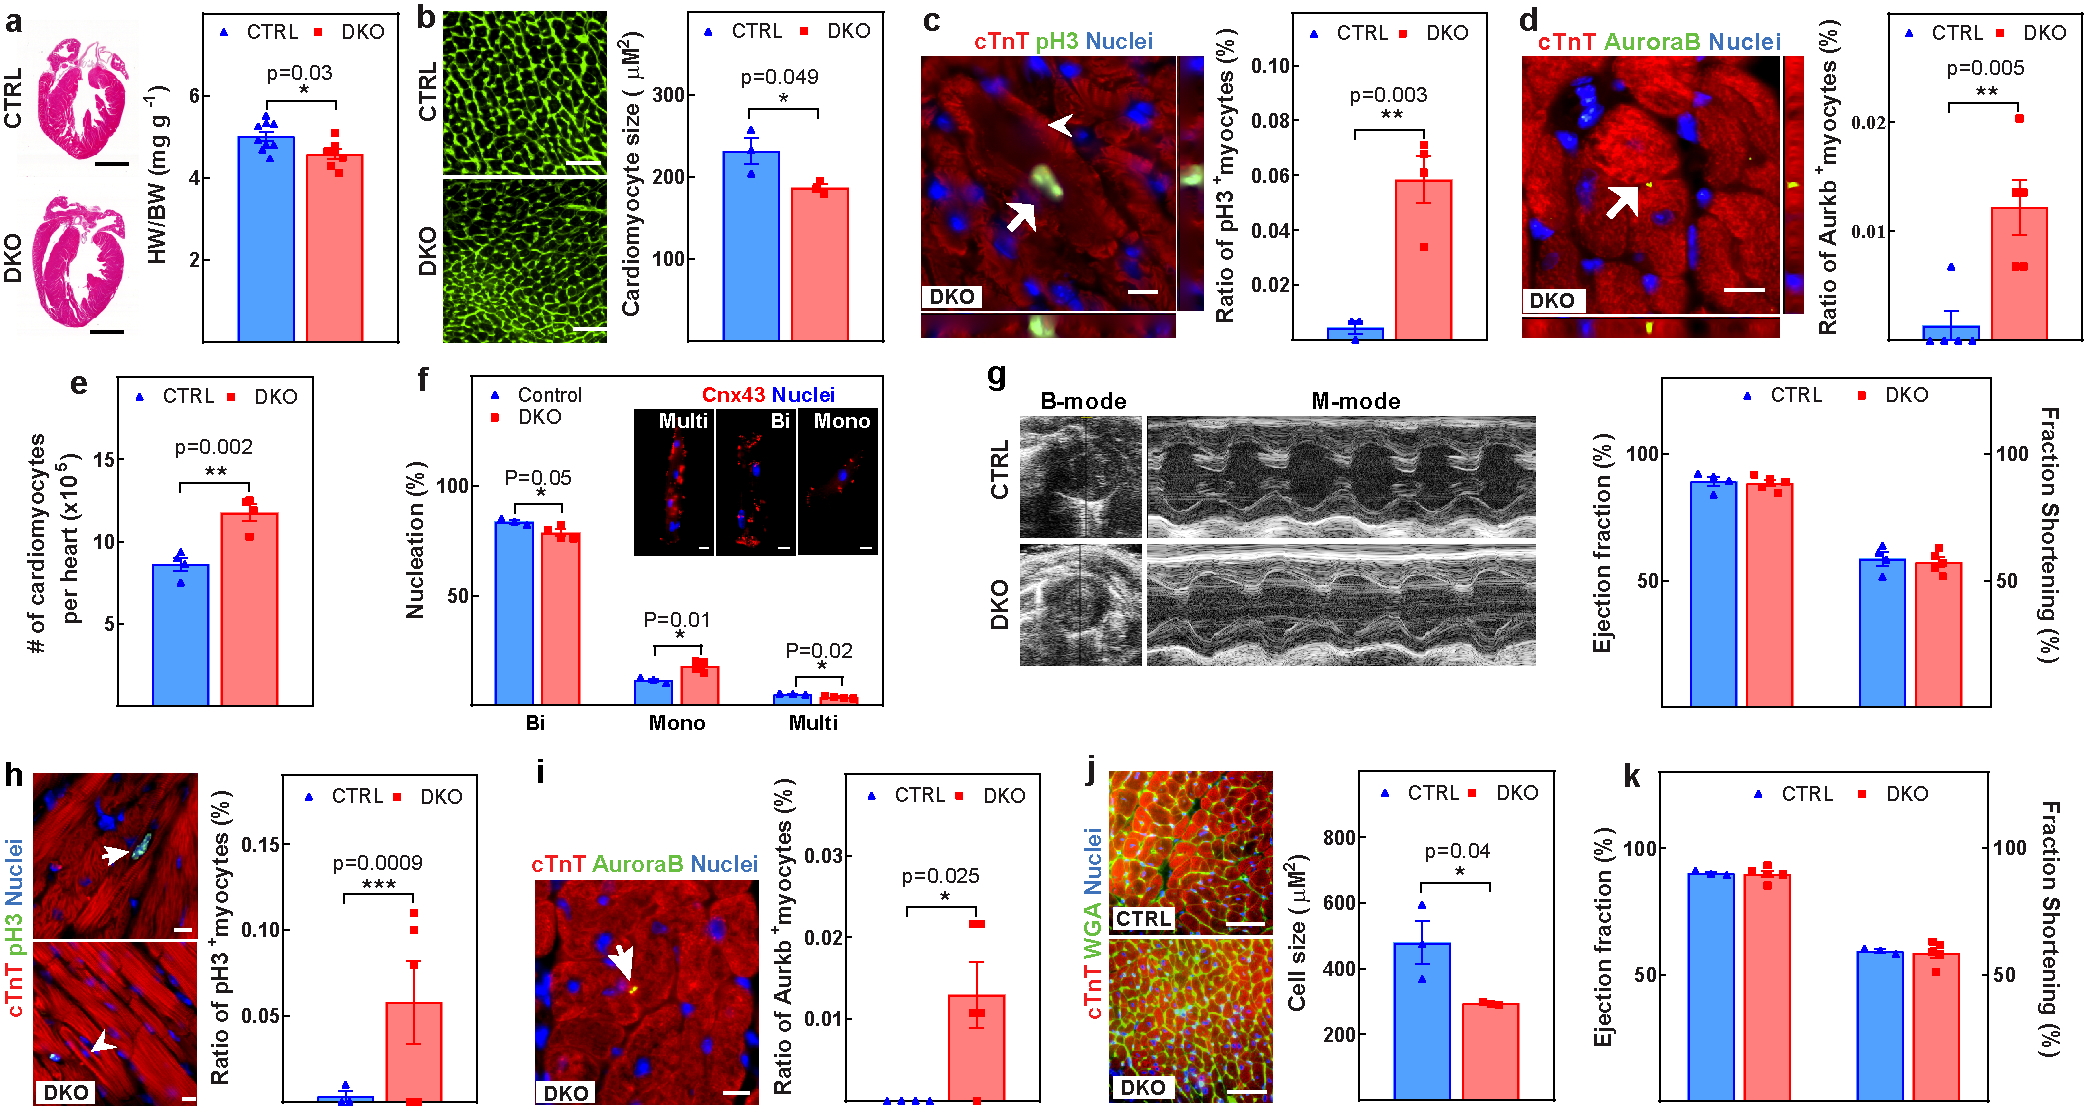
Extended Data Fig. 3. Concurrent knockout of Meis1 and Hoxb13 preserves cardiomyocyte proliferative capacity.

a–g, Assessment of control and DKO hearts at P28. a, Representative images of haematoxylin and eosin-stained heart sections and heart weight/body weight ratio. b, Representative images of WGA staining and cardiomyocyte cross-sectional area quantification. c, Representative images of immunostaining for PH3 (green), cardiac troponin T (red) and nucleus (blue) (left) and the percentage (right) of mitotic cardiomyocytes (arrow). Arrowhead indicates sarcomere disassembly. d, Representative images of immunostaining for aurora B kinase (green), cardiac troponin T (red) and nucleus (blue) (left) showing the percentage (right) of cardiomyocytes undergoing cytokinesis (arrow). e, f, Total number of cardiomyocytes (e) and quantification of nucleation (f). Cnx43, connexin-43. g, Representative echocardiography and LV systolic function. h–k, Assessment of control and DKO hearts at 6 months of age. h, Representative images of immunostaining for PH3 (green), cardiac troponin T (red), and nucleus (blue) (left) and the percentage (right) of mitotic cardiomyocytes (arrow). Arrowhead indicates cardiomyocytes with sarcomere disassembly. i, Representative images of immunostaining for aurora B kinase (green), cardiac troponin T (red) and nucleus (blue) (left) and the percentage (right) of cardiomyocytes undergoing cytokinesis (arrow). j, Representative images of WGA (green), cardiac troponin T (red) and nucleus (blue) staining (left) and cardiomyocyte CSA quantification (right). k, LV systolic function quantified by ejection fraction in 6-month-old DKO mice. Data are mean ± s.e.m.; unpaired two-sided t-test. *P < 0.05, **P < 0.01, ***P < 0.001. For n values, see Methods. Scale bars, 10 μm (c, d, f, h, i), 50 μm (b, j), 1 mm (a).
