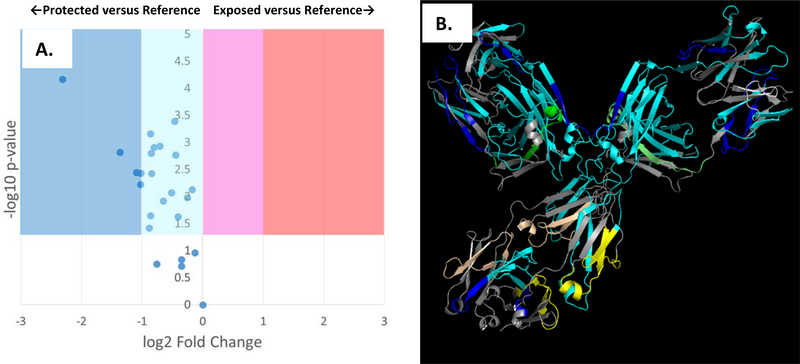
Figure 2: FPOP comparison of adalimumab biosimilar in 50 mM sodium citrate buffer (pH 6.0) after dosimetry-based compensation versus 50 mM sodium phosphate buffer (pH 6.0) as a reference.
FPOP was performed with 15% exclusion volume, 100 mM H2O2, in 100 μm ID capillary, with the radical dosage altered to generate equivalent adenine dosimetry readings. (A.) Volcano plot of FPOP results, using oxidation in sodium phosphate as the reference sample. Each point represents one peptide from the biosimilar, with the X-axis representing the fold change in oxidation amount in citrate buffer as compared to phosphate buffer, and the Y-axis representing the p-value from a two-tailed Student’s t-test. The four shaded regions represent statistically significant changes in oxidation (α = 0.05), with the shade representing the color coding used in the structural visualization. (B.) Structural visualization of the differential FPOP data plotted in the volcano plot. Cyan: <2x decrease in oxidation; Blue: >2x decrease in oxidation; Magenta: <2x increase in oxidation; Red: >2x increase in oxidation; Grey: regions of the protein where no oxidized peptide was detected in any sample. Regions that showed no statistically significant changes in oxidation are colored green (light chain) or yellow (heavy chain).

