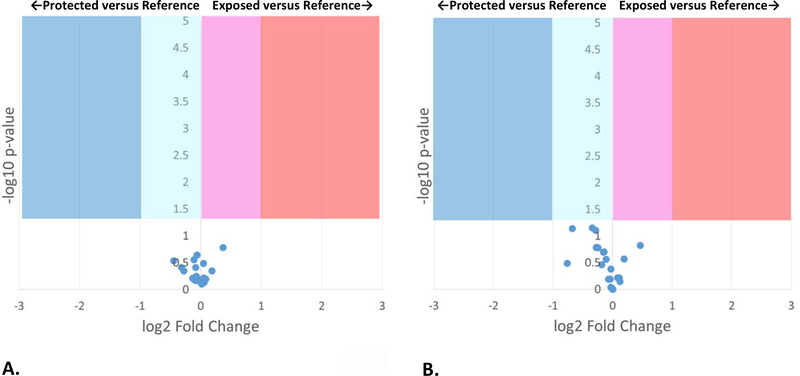
Figure 6: FPOP volcano plots of adalimumab biosimilar with 0.1% polysorbate-80 after heat shock versus a room temperature reference.
FPOP was performed with 15% exclusion volume, 100 mM H2O2, in 100 μm ID capillary. Each point represents one peptide from the biosimilar, with the X-axis representing the fold change in oxidation amount after heat shock as compared to the reference, and the Y-axis representing the p-value from a two-tailed Student’s t-test. The four shaded regions represent statistically significant changes in oxidation (α = 0.05). (A.) Adalimumab biosimilar in 50 mM sodium phosphate (pH 6.0); (B.) Adalimumab biosimilar in 50 mM sodium citrate (pH 6.0).

