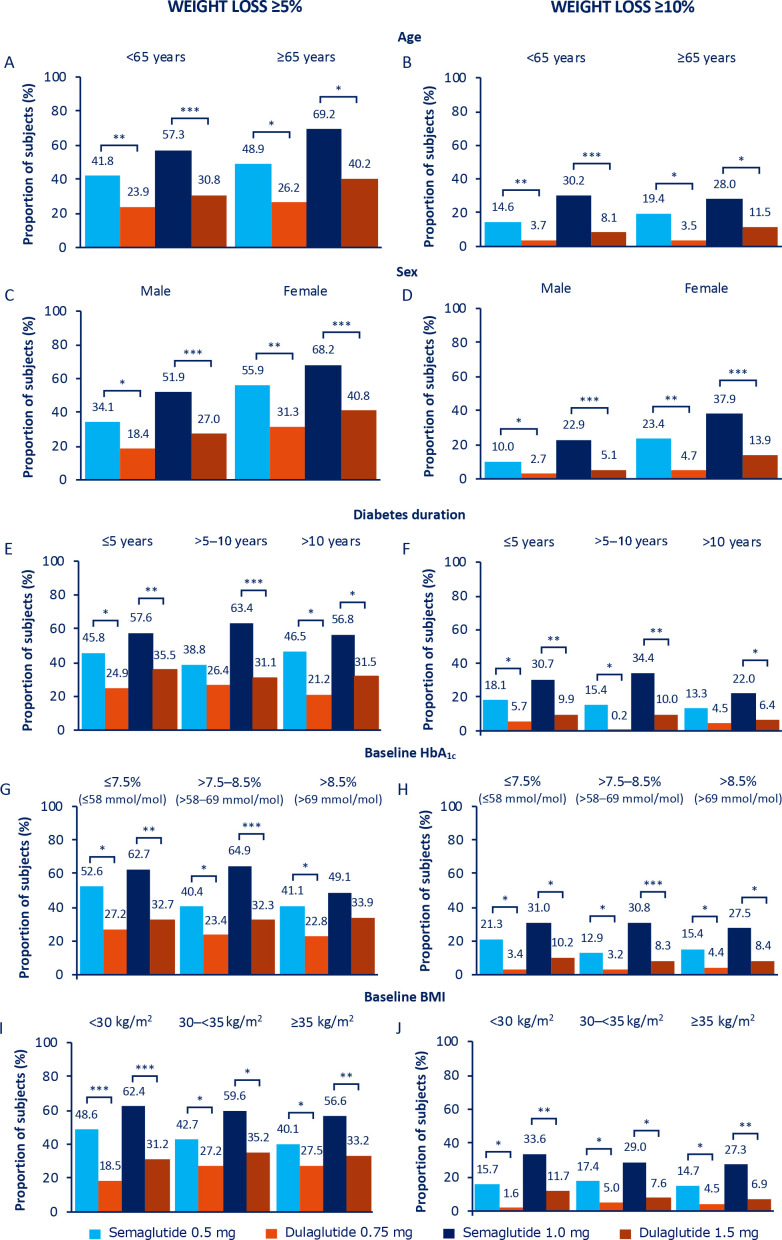
Figure 2.
Proportion of subjects achieving weight loss ≥5% (A, C, E, G and I) and weight loss ≥10% (B, D, F, H and J) at 40 weeks. *P<0.05, **p<0.001, ***p<0.0001. Values are estimated proportions from ANCOVAs with multiple imputations using ‘on-treatment without rescue medication’ data from all randomised subjects exposed to at least one dose of trial product as randomised (full analysis set) obtained while on treatment and prior to onset of rescue medication. P values are based on ETDs; statistical analyses were not performed for change from baseline. ANCOVAs, analysis of covariances; BMI, body mass index; ETDs, estimated treatment differences; HbA1c, glycated haemoglobin.

