
Fig. 5.
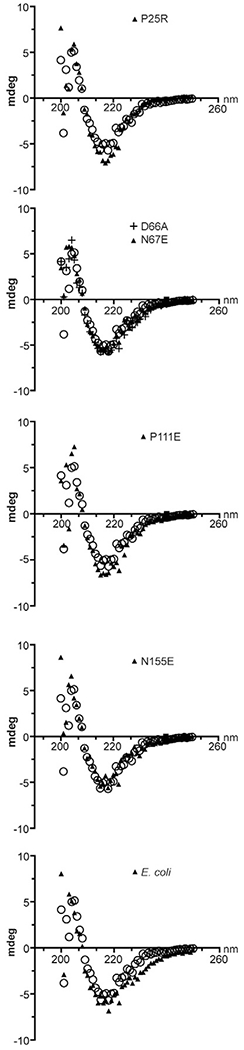
CD spectra of selected OmpA-TMs. Representative CD spectra of OmpA-TME.coli and OmpA-TM variants are shown. Open circles indicate the CD spectrum of OmpA-TMS.flex and are the same data shown in each panel.
Official websites use .gov
A
.gov website belongs to an official
government organization in the United States.
Secure .gov websites use HTTPS
A lock (
) or https:// means you've safely
connected to the .gov website. Share sensitive
information only on official, secure websites.
CD spectra of selected OmpA-TMs. Representative CD spectra of OmpA-TME.coli and OmpA-TM variants are shown. Open circles indicate the CD spectrum of OmpA-TMS.flex and are the same data shown in each panel.