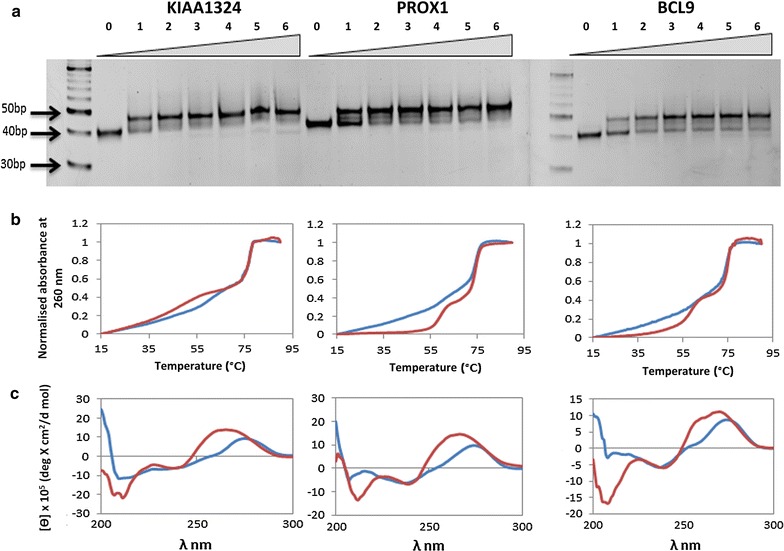
Fig. 5.

a Gel Retardation Assay: duplex DNA incubated alone (lane 1) or with increasing concentrations of RNA TFO depicting gel mobility shift with formation of triplex. b UV melting assay: UV spectra of duplex and triplex (1:3::duplex:RNA TFO) representing the biphasic melting transitions for triplex (red) and single melting peak for duplex (blue curve). c CD spectroscopy: CD spectra of duplex and triplex (1:3::duplex:RNA TFO) represented with blue and red curves respectively, indicating the sharp negative peak obtained at 210 nm for the triplex
