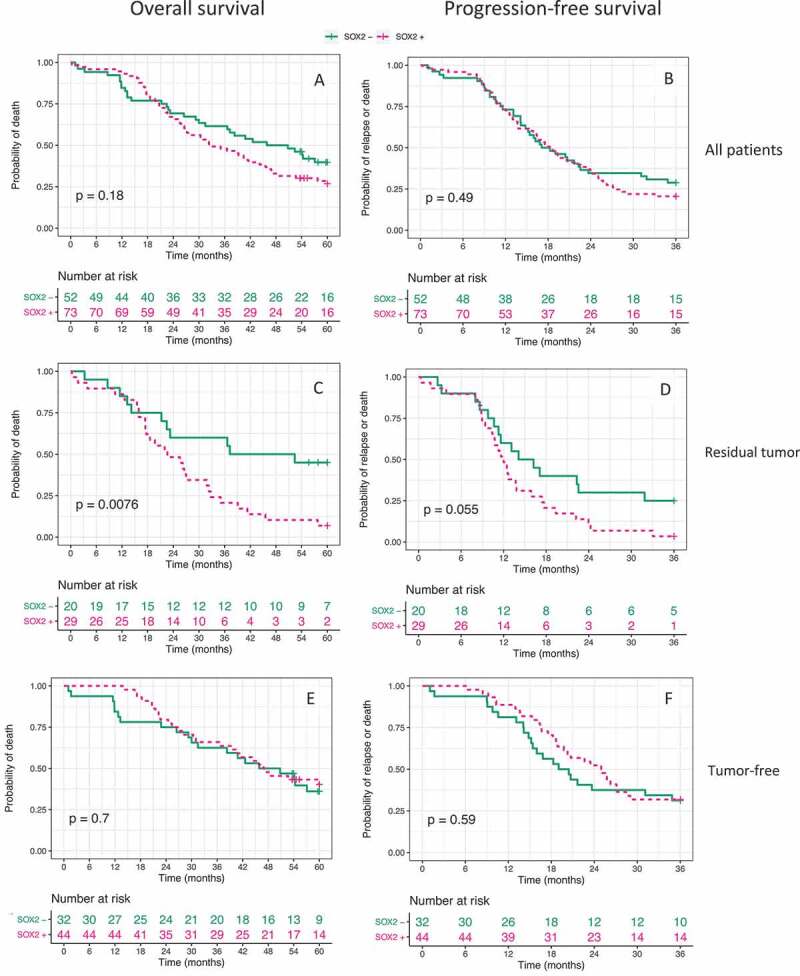
Figure 3.

Kaplan-Meier estimates for OS and PFS. (A, B)
All 125 patients; (C, D) Patients with residual tumor after surgery (n = 49); (E, F) Macroscopically tumor-free patients (n = 76). P-values displayed represent results from log-rank tests.

Kaplan-Meier estimates for OS and PFS. (A, B)
All 125 patients; (C, D) Patients with residual tumor after surgery (n = 49); (E, F) Macroscopically tumor-free patients (n = 76). P-values displayed represent results from log-rank tests.