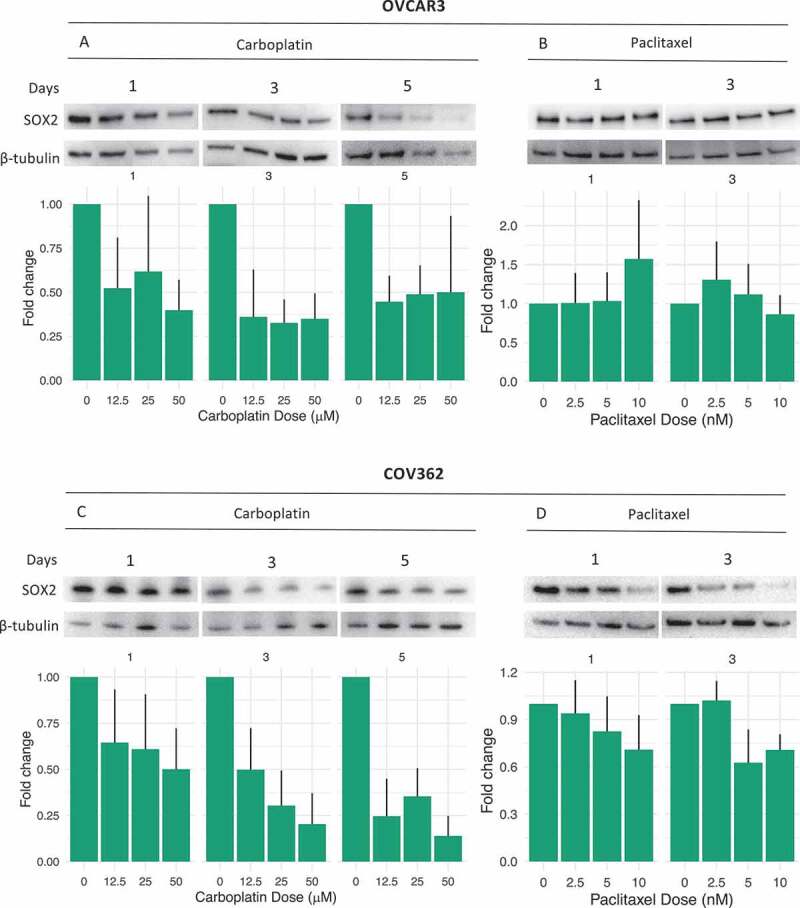
Figure 4.

SOX2 expression following chemotherapy treatment
RT-PCR and Western blots displaying SOX2 mRNA and SOX2 protein expression following chemotherapy treatment. (A, C) SOX2 protein/mRNA levels following 1,3 and 5 days of exposure to carboplatin. (B, D) SOX2 protein/mRNA levels following 1 and 3 days of exposure to paclitaxel. mRNA fold-changes are normalized to the reference gene RPS10. Data are expressed as mean ± SEM of three independent experiments. Corresponding stain-free blots for the Western blotting can be found in Supplementary Figure S3 and barplots of quantified data are available in Supplementary Figure S4.
