
Figure 2.
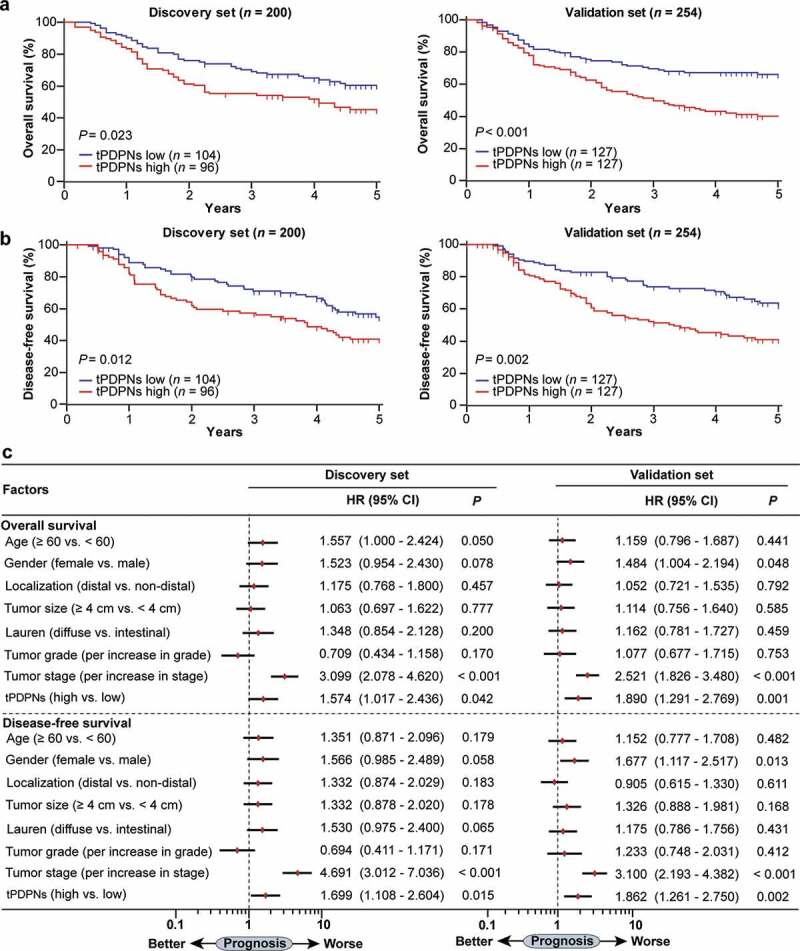
tPDPNs predict poor prognosis in gastric cancer. (a-b) Kaplan-Meier curves for overall survival (OS) and disease-free survival (DFS) in gastric cancer patients according to tPDPNs status in Discovery set and Validation set. The OS (a) and DFS (b) were compared between tPDPNs low and high subgroups. Log-rank test was performed for Kaplan-Meier curves. (c) Multivariate analysis of OS and DFS were conducted on the basis of clinicopathological characteristics in Discovery set and Validation set. HR, hazard ratio; CI, confidence interval