
Figure 4.
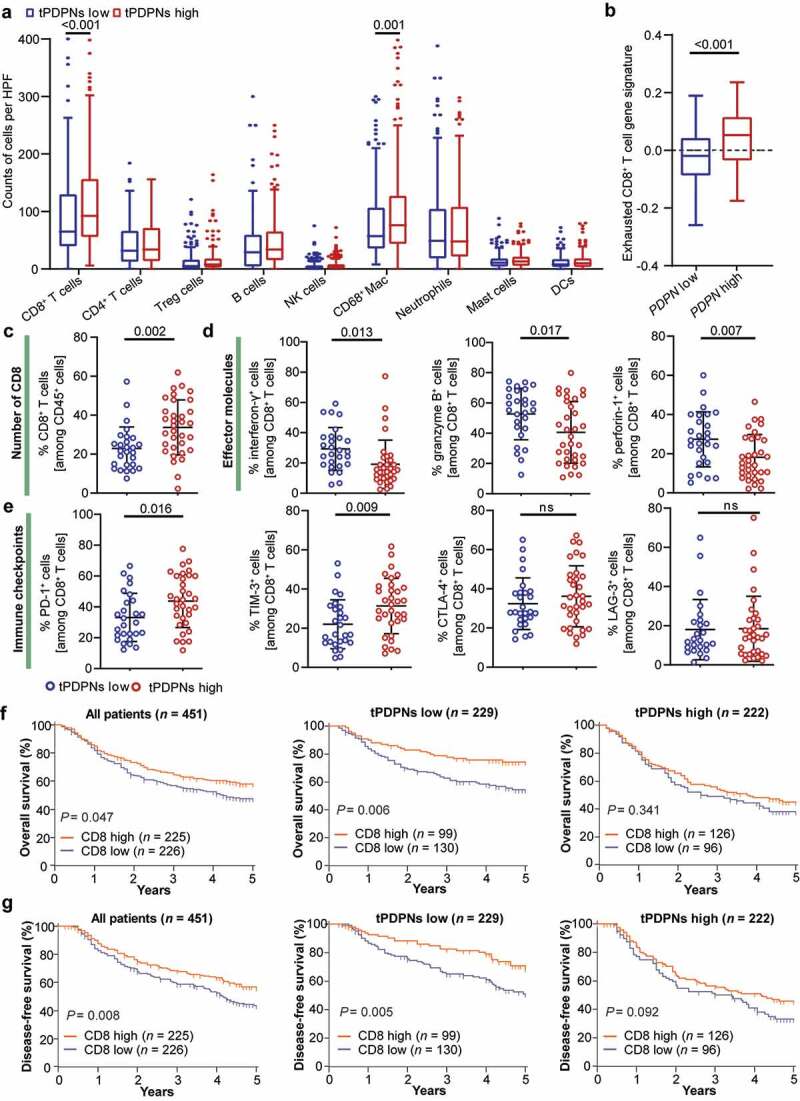
tPDPNs are associated with an exhausted CD8+ T-cell phenotype in gastric cancer. (a) Immunohistochemistry analysis of the immune contexture in tPDPNs low and high subgroups. Treg, regulatory T; NK, natural killer; Mac, macrophages; Neu, neutrophils; DCs, dendritic cells. (b) Relationship between PDPN mRNA level and exhausted CD8+ T cell gene signature in TCGA database. (c-e) Flow cytometry to detect the number of CD8+ T cells in CD45+ cells (c), the expression of effector molecules (interferon-γ, granzyme B and perforin-1) in CD8+ T cells (d) and immune checkpoints (PD-1, TIM-3, CTLA-4 and LAG-3) in CD8+ T cells (e) between tPDPNs low and high subgroups. Unpaired t test. ns refers to not significant. PD-1, programmed death-1; TIM-3, T-cell immunoglobulin and mucin-domain containing-3; CTLA-4, cytotoxic T-lymphocyte-associated protein-4; LAG-3, lymphocyte-activation gene-3. (f-g) The overall survival (OS) curves (f) and disease-free survival (DFS) curves (g) in all gastric cancer patients, tPDPNs low subgroup and tPDPNs high subgroup according to CD8+ T cell status. Log-rank test was performed for Kaplan-Meier curves