
Figure 5.
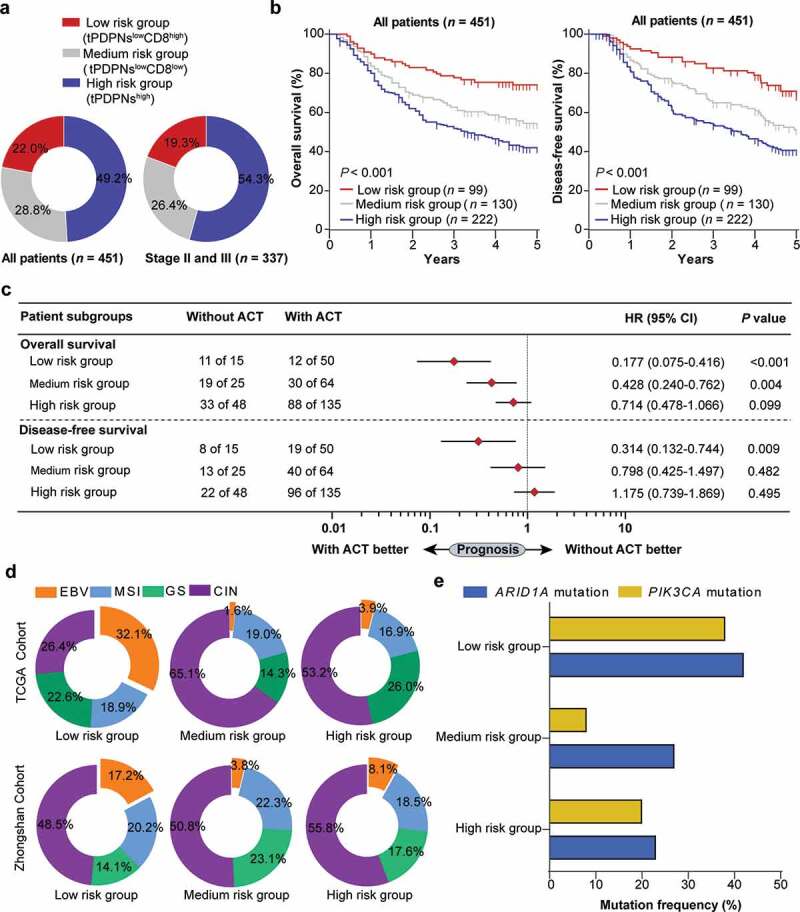
Stratification based on tPDPNs and CD8+ T cells are associated with prognosis, therapeutic responsiveness to ACT and molecular classification. (a) Pie charts show the proportion of three stratified risk groups in all or stage II and III gastric cancer patients. (b) The overall survival (OS) curves and disease-free survival (DFS) curves for three stratified risk groups. Log-rank test was performed for Kaplan-Meier curves. (c) Cox regression analysis for the difference of responsiveness to adjuvant chemotherapy (ACT) in three risk groups. HR, hazard ratio; CI, confidence interval. (d) Pie charts show the proportion of molecular subtypes including EBV, MSI, GS and CIN in three stratified risk groups in TCGA cohort (up) and Zhongshan cohort (down). EBV, Epstein–Barr virus; MSI, microsatellite instability; GS, genomically stable; CIN, chromosomal instability. (e) ARID1A and PIK3CA gene mutation frequency in three stratified risk groups