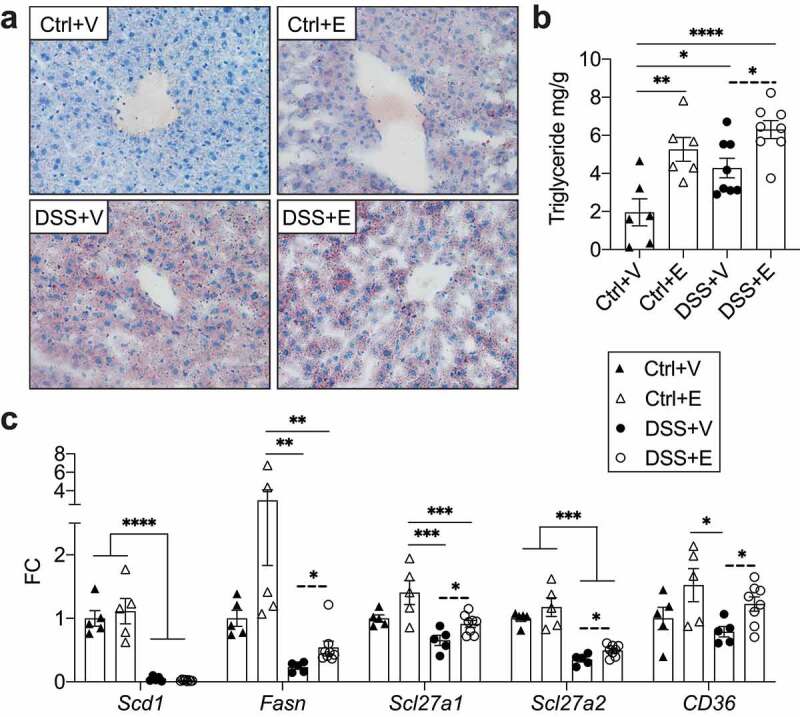
Figure 6.

Increased lipid deposition and gene expression associated with lipid synthesis and uptake in DSS+Ethanol livers. (a) Oil Red O stain of frozen liver sections harvested from mice after euthanasia on day 7. Images taken at 400x total magnification. Representative images of n = 6–8 per group. (b) Liver triglyceride mg/g of liver tissue. n = 6–8 per group. (c) Expression of hepatic lipid synthesis and uptake genes. n = 5–8 per group. Bars display mean ± SEM, with each symbol representing data from one mouse. FC: Fold change. Solid lines indicate statistics by One-Way ANOVA with Tukey post-hoc test. Dashed lines indicate significance by student’s t-test. * p < .05, ** p < .01, *** p < .001, **** p < .0001
