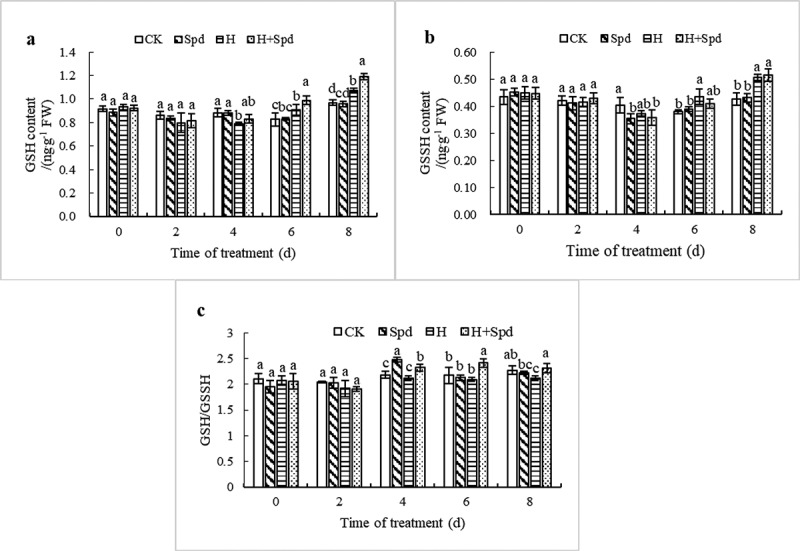
Figure 5.

Effects of exogenous spd on the GSH content (a), GSSH content (b), and the GSH/GSSH ratio (c) of lettuce seedlings under high-temperature stress. The vertical bars represent the SDs of the means (n = 3). The different letters indicate significant differences at P < .05 according to Duncan’s multiple range test
