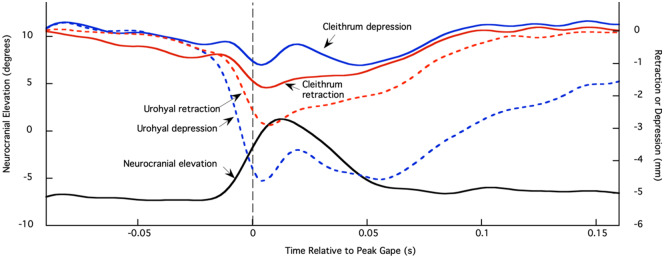
Fig. 4.
Neurocranial elevation (degrees) and retraction and depression of the urohyal and cleithrum (millimeter) markers from one feeding event. Left axis is neurocranial rotation in degrees relative to the body plane and right axis is retraction or depression (in millimeter) of the urohyal and cleithrum markers (see Fig. 3 for marker placements and ACS). Neurocranium, black; urohyal retraction, red dashed; urohyal depression, blue dashed; cleithrum retraction, red solid; cleithrum depression, blue solid. Time zero and gray dashed line correspond to peak gape.

