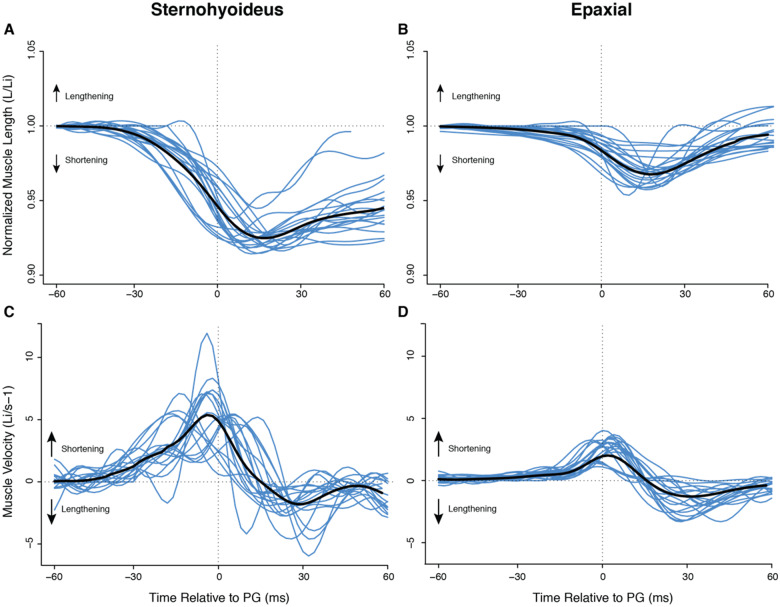
Fig. 6.
Normalized muscle length and velocity during suction feeding in E. lateralis. Time is relative to peak gape. Traces from individual strikes (blue lines) are shown (n = 22 strikes from four individuals), with the mean for all strikes in black. (A, B) Change in muscle length over time normalized by mean initial muscle length (Li) for epaxial and SH, respectively. Decreasing values indicate shortening. (C, D) Instantaneous velocity for epaxial and SH. For velocity, positive values indicate shortening.

