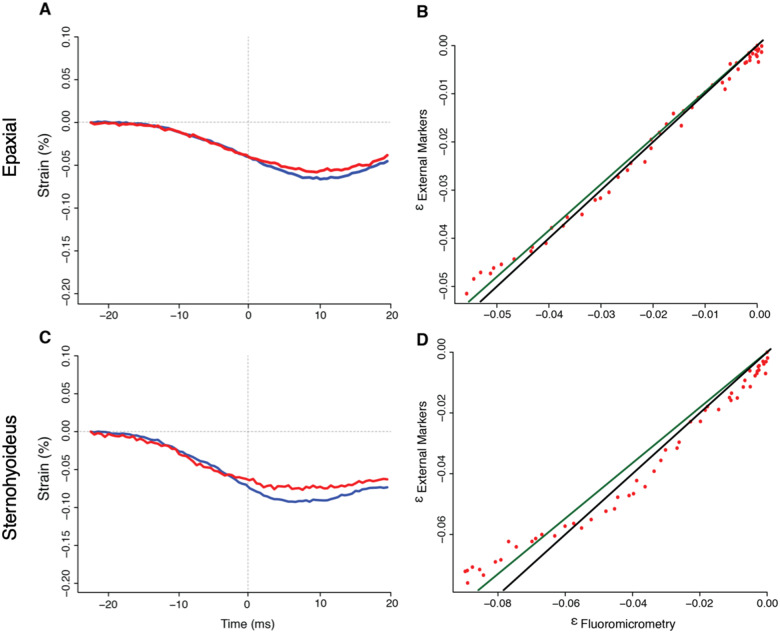
Fig. 7.
Evaluation of external muscle marker tracking method relative to fluoromicrometry for SH and epaxial muscle length in a bluegill sunfish, L. macrochirus, for a representative trial. Muscle strain was measured both by fluoromicrometry (blue) and external marker tracking (red) for (A) epaxial and (C) SH muscles. Regression plots comparing the generated strain values from both methods are presented for the (B) epaxial and (D) SH. Strain measurements were compared following methods in Camp et al. (2016). External marker strain is plotted as a function of fluoromicrometry measured strain and fit with a linear regression line (dark green), the slope of which was compared to the 1:1 ratio of the ideal line (black). Red points represent the true strain calculations when plotting εexternal as a function of εfluoromicrometry. ε is a SI unit for the unit-less strain.

