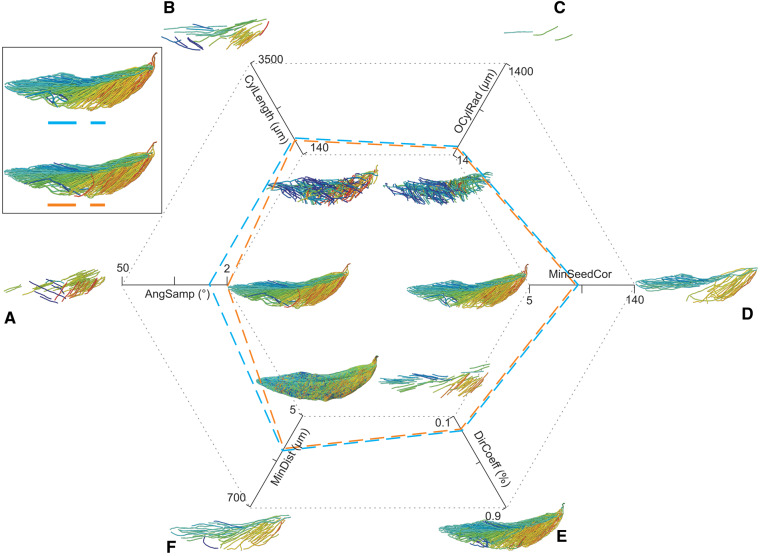
Fig. 5.
Illustration of the sensitivity analysis. Parameters were individually increased and decreased relative to the baseline target model. Smaller models represent the extremes of each parameter’s indicated range with other parameters set constant at the values indicated by the blue dashed line. Boxed models depict the optimized model (orange dashed line) and the baseline target model (blue dashed line) prior to manual tract editing and smoothing. (A) Angular Sampling (AngSamp), (B) Cylinder Length (CylLength), (C) Outer Cylinder Radius (OCylRad), (D) Minimum Seed Correlation (MinSeedCor), (E) Direction Coefficient (DirCoeff), (F) Minimum Distance (MinDist).

