
Figure 3.
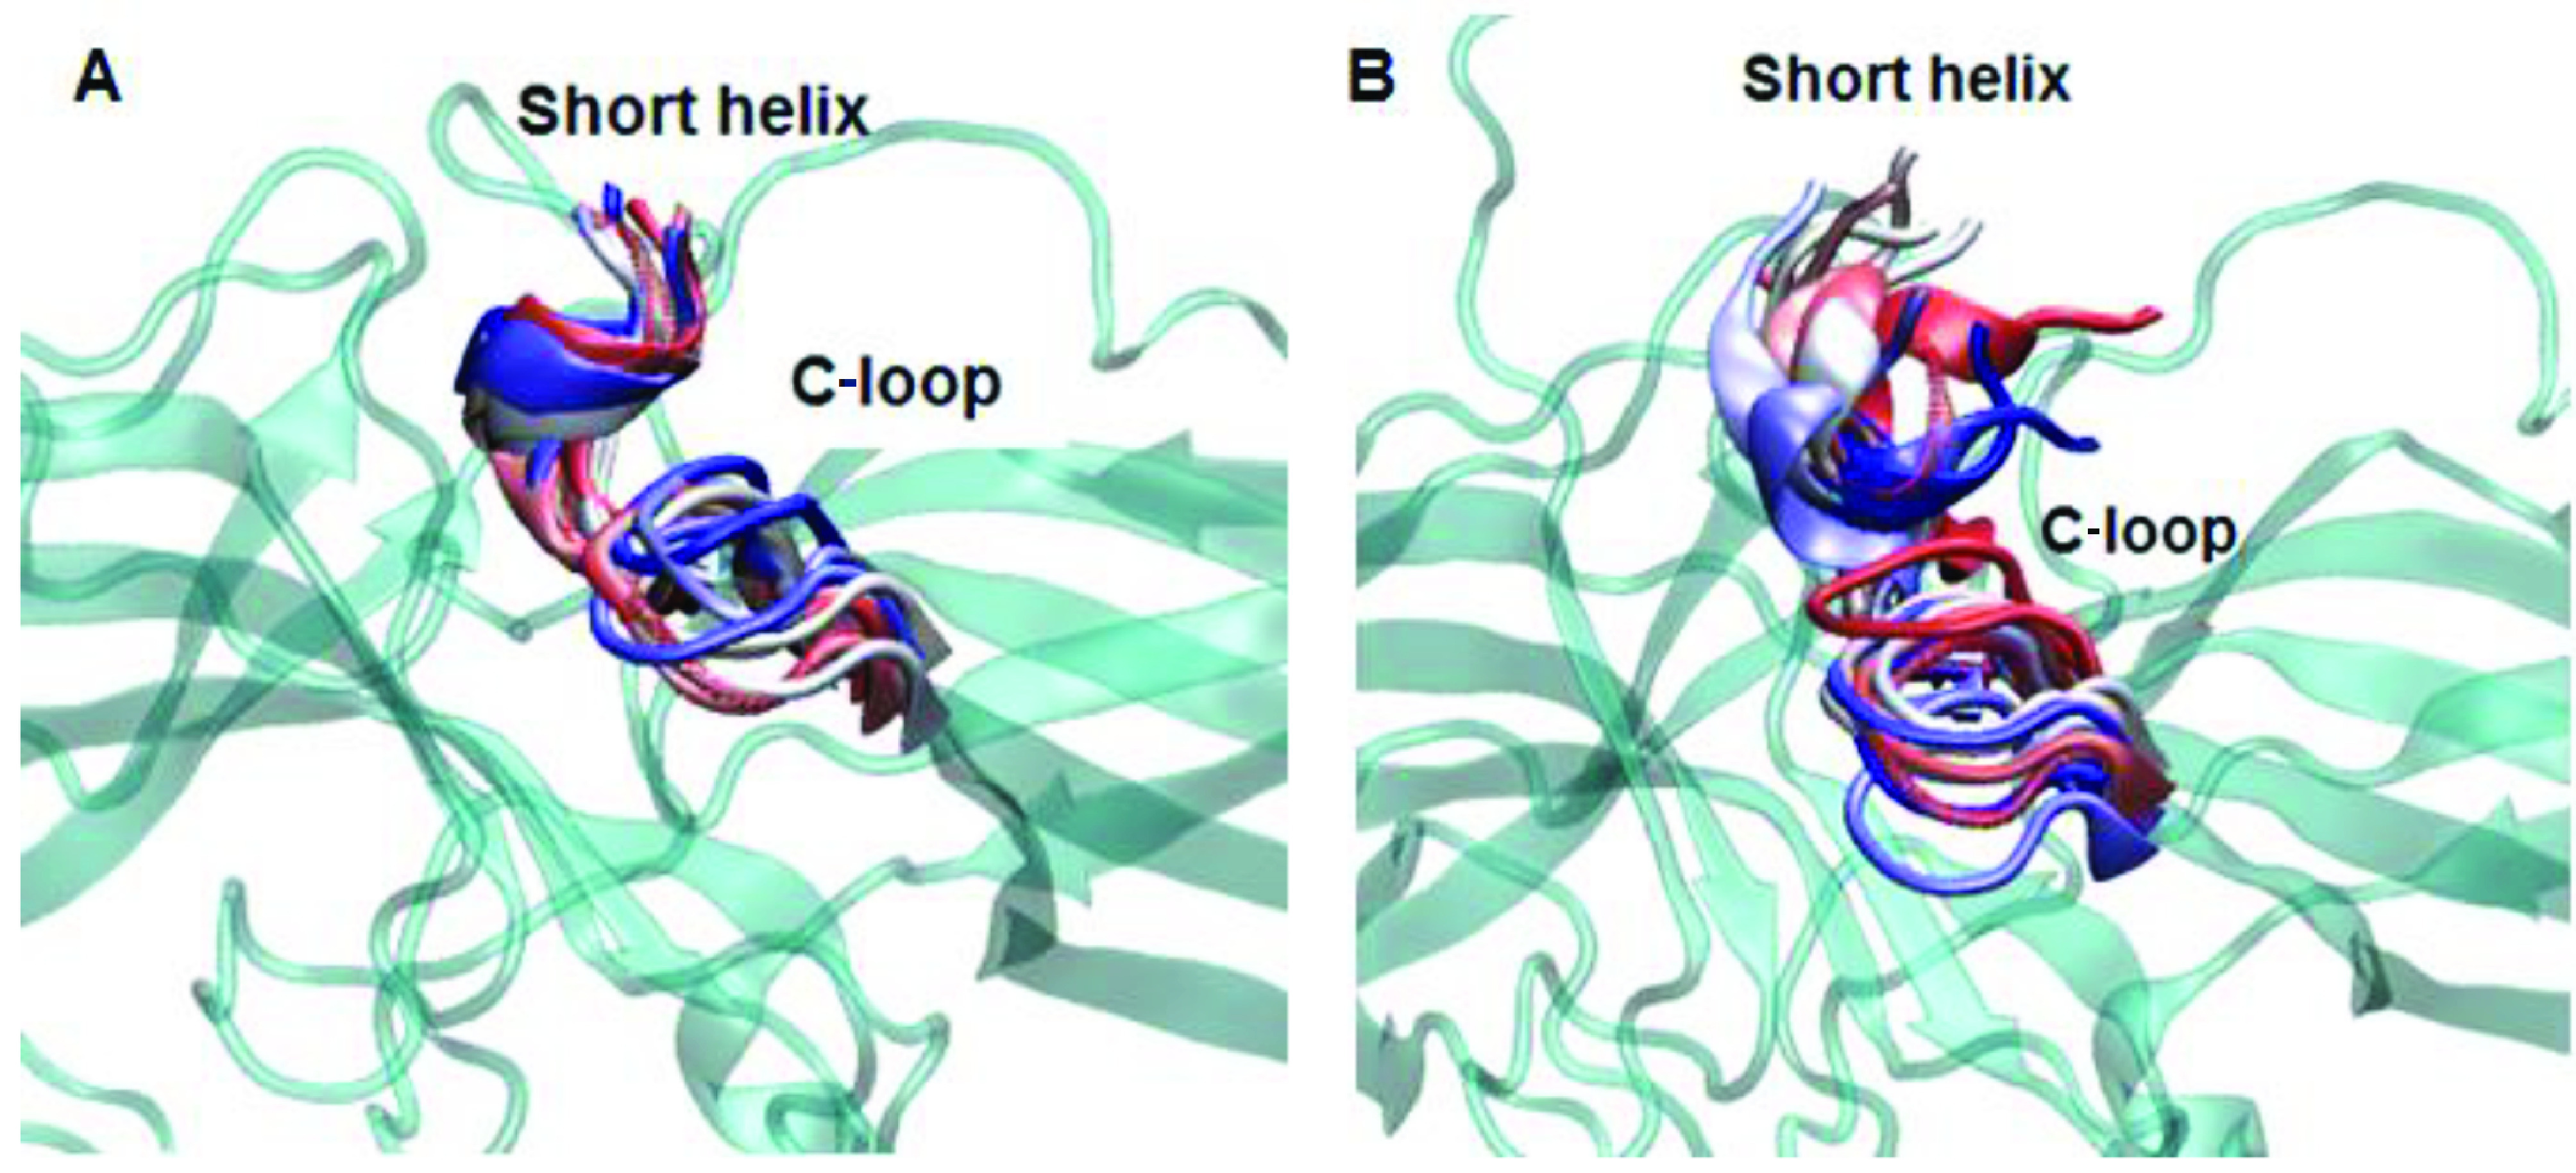
Dynamics representation of the C-loop throughout the simulation in A. WT and B. mutant protein. 3D structure of the protein is shown in cyan and cartoon representation. The short helix and the C-loop are colored with respect to the frame number: from red to blue–the number of the frame increases.