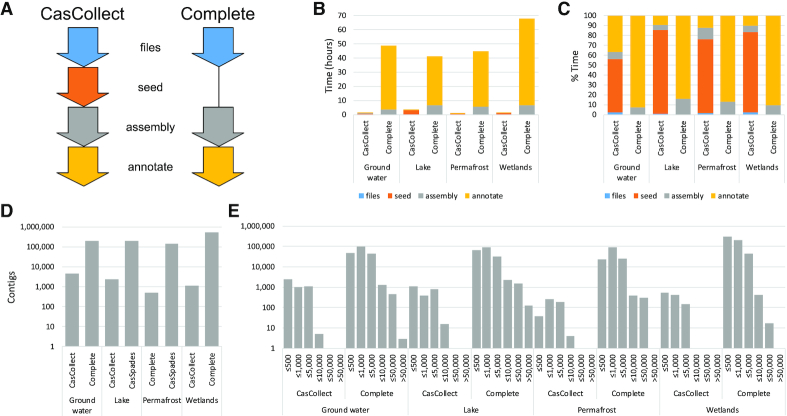
Figure 2.
Comparative analysis of the CasCollect and complete assembly pipelines for metagenomic datasets. (A) Schematic of the four steps for the CasCollect and complete assembly pipelines: files (blue) for trimming and stripping qualities; seed (orange) for the seed generation, expansion and reassigning qualities; assembly (gray) for contig building; and annotate (yellow) for detecting cas genes and CRISPR arrays to generate a GFF3 output file. (B) Timings for each pipeline for each metagenome and steps. (C) Percentage breakdown for time required for each step. (D) Number of contigs generated by each pipeline with (E) the length distribution for CasCollect and complete assembly. Colors for each step in (A) are used for the charts in (B) and (C).

