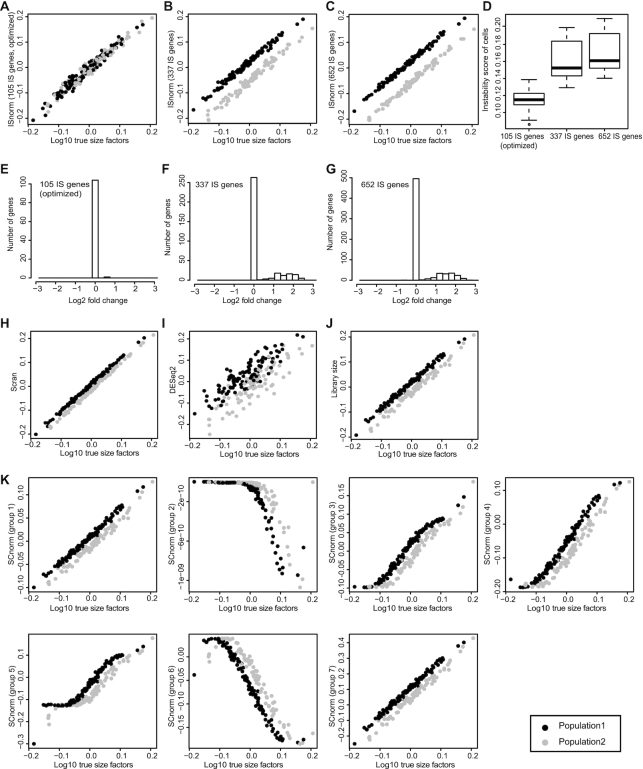
Figure 2.
Performance of ISnorm and other existing methods in the Smart-seq2 simulation. (A–C) Size factors estimated by ISnorm. (D) Instability scores of cells for each candidate set. (E–G) Distribution of log2 fold change of IS genes in each candidate set. (H–K) Size factors estimated by other existing methods. Black and gray dots represent cell population 1 and cell population 2, where 30% genes in population 2 are differentially expressed.

