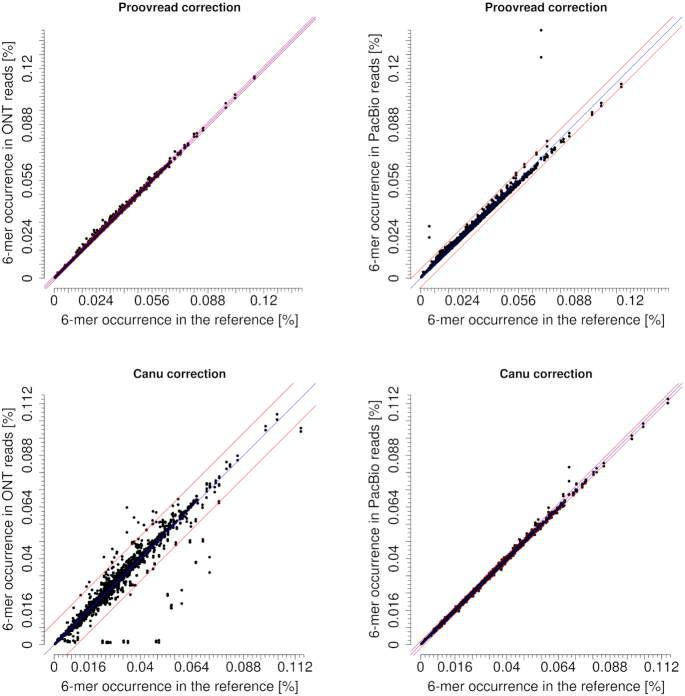
Figure 10.
Frequencies of six-mers after correction by proovread and Canu (MHAP), respectively, in ONT reads (left) and PacBio reads (right) compared to the reference. Unpatched input reads were used. The diagonal blue line stands for perfect representation. The two red lines indicate the 3-fold standard deviation (proovread: ONT stddev = 0.0004, PacBio stddev = 0.0017, Canu: ONT stddev = 0.0035, PacBio stddev = 0.0005).

