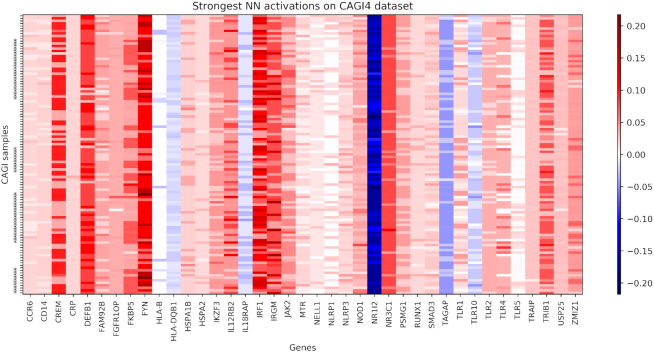
Figure 4.
NN gene activation patterns when predicting the CAGI4 dataset. Samples are listed on the y-axis and the asterisks indicates positive samples. The genes with the highest activations are shown on the x-axis. Red colors indicate that the activation is pushing towards the positive class (CD case), while blue colors indicate genes voting for the negative (controls) class.

