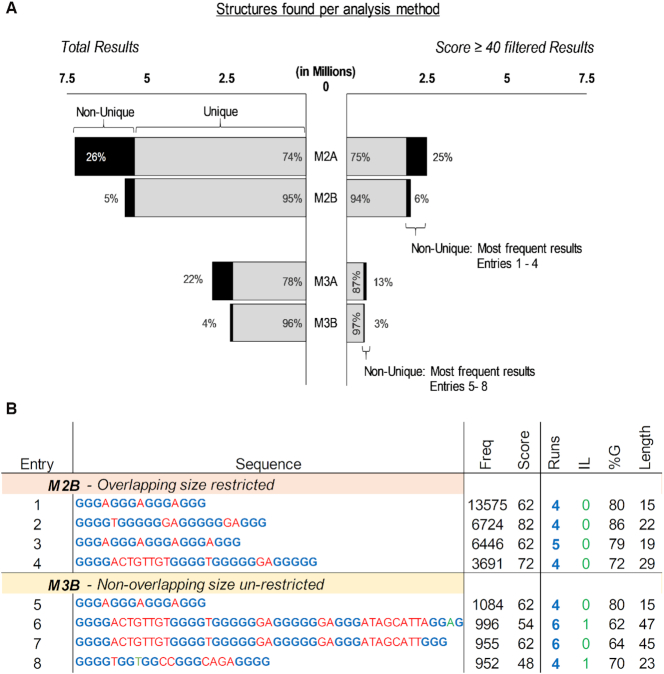
Figure 2.
(A) Total found PQS (left) and found PQS after filtering by score (right) within the entire human genome per method of analysis. The results are divided into unique structures (found with a frequency of 1, in gray), and non-unique structures (found with a frequency of more than 1, in black). The percentage regarding the total is also shown in between parenthesis. (B) Top four most frequent PQS found within the filtered by score results per method of analysis. Sequence portions in blue are the detected G-runs, in green the run bulges and in red the loops. Score is the average between G4Hunter and PQSfinder. Abbreviations: Freq is frequency, IL is total run bulges and %G is the percentage of G in the sequence.,

