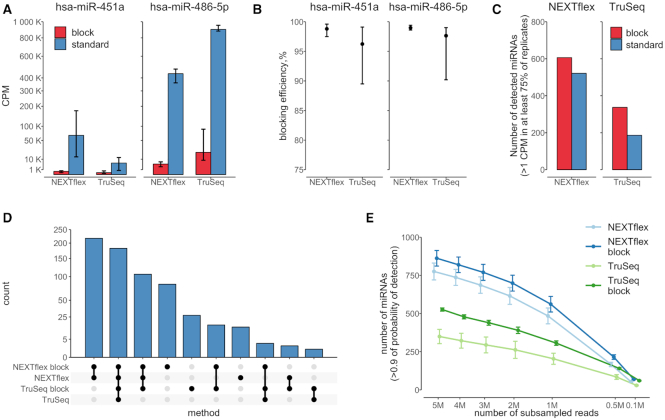
Figure 3.
Blocking oligonucleotides efficiently suppress miR-486-5p and miR-451a and increase detectability of other miRNA species in small RNA libraries. (A) A bar chart represents quantitative estimates of miR-486-5p and miR-451a in blocked (red) and unblocked (blue) libraries prepared by NEXTflex and TruSeq protocols. The y-axis depicts counts per million (CPM) and it is scaled by square root. The error bars indicate min and max values obtained from replicates. The graph illustrates a high degree suppression of miR-451a and miR-486-5p sequences in blocked NEXTflex and TruSeq libraries; (B) A dot plot represents blocking efficiencies (y-axis) of miR-486-5p and miR-451a in NEXTflex and TruSeq libraries. The data points depict mean values, whereas the error bars indicate min and max values obtained from replicates. The overall blocking efficiency is observed to be slightly better in the NEXTflex than in the TruSeq small RNA libraries (Wilcoxon P-value = 0.012); (C) A bar chart shows number of detected miRNA species (y-axis) in blocked (red) and unblocked (blue) libraries prepared by NEXTflex and TruSeq protocols. The detectability of miRNAs is increased in both blocked NEXTflex and TruSeq libraries; (D) An upset plot representing intersection of uniquely detected miRNA species amongst the set of the four protocols. The highest numbers of uniquely detected miRNAs are found in blocked libraries; (E) A line chart illustrates number of detected miRNAs (y-axis) in subsamples (x-axis; scaled by square root) of down-sampled libraries prepared by different protocols. The data points represent mean values, whereas the error bars depict standard errors of the mean. The graph displays a steady increase of detected miRNAs over the increasing size of subsampled miRNA counts.

