Figure 4.
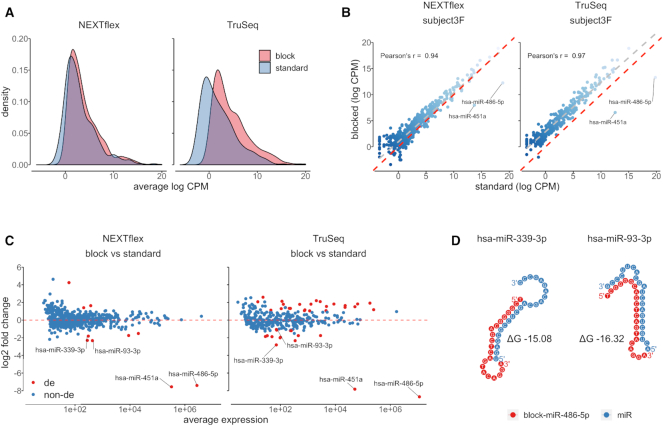
Blocking oligonucleotides for miR-486-5p and miR-451a have positive and some negative effects on measured expression of non-targeted miRNAs. (A) A density chart shows distributions of averaged log2-transformed CPM values of blocked (red) and unblocked (blue) libraries prepared by NEXTflex and TruSeq protocols. The expression values of each miRNA were averaged per protocol (x-axis). The graph illustrates a proportional global shift of log2-transformed CPM values toward higher expression estimates in both blocked NEXTflex and TruSeq libraries; (B) A scatter plot represents correlation of log2-transformed CPM values of paired blocked (y-axis) and unblocked (x-axis) exemplary libraries generated by NEXTflex and TruSeq protocols. The red dashed line divides panel in two equal parts, whereas the grey dashed line displays a linear regression curve. The chart illustrates a high concordance of miRNA expression values between blocked and unblocked paired libraries; (C) An MA plot shows paired-differential expression analysis results of blocked versus unblocked libraries, where log2 fold changes are presented on the y-axis and averaged normalized counts on the x-axis. The red colored dots indicate significantly differentially expressed miRNAs (corrected P-value < 0.01; absolute value of log2 fold change > 1). The miRNAs which were found to be downregulated in both NEXTflex and TruSeq libraries are labeled with miRNA names; (D) A dot chart represents predicted non-specific interactions between miR-486-5p blocking oligonucleotide (red) and two non-targeted miRNA molecules (blue). These interactions might cause decreased expression of miR-339-3p and miR-93-3p in blocked small RNA libraries.

