Figure 12.

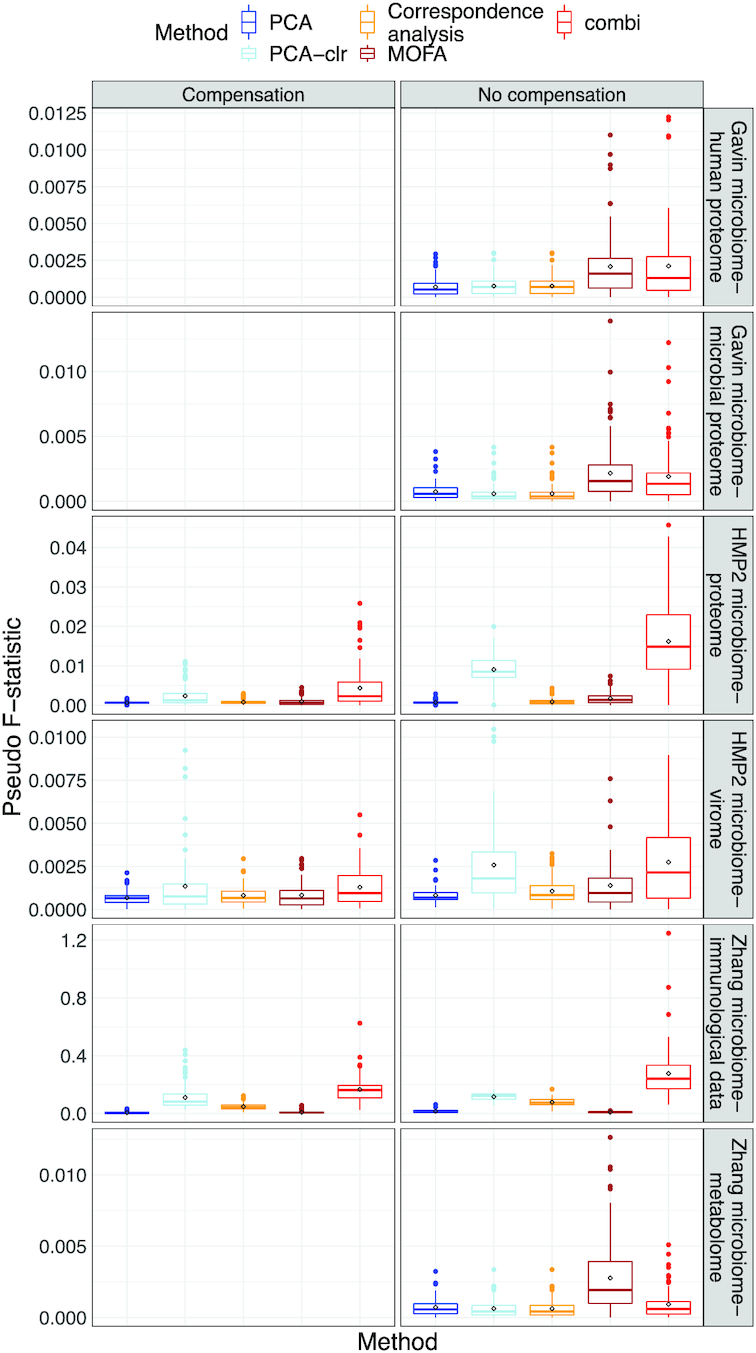
Simulation study. Boxplots of pseudo-F statistic (y-axis) quantifying sample separation for different methods (x-axis) and templates (top panels) under parametric simulation (Strategy 1).

Simulation study. Boxplots of pseudo-F statistic (y-axis) quantifying sample separation for different methods (x-axis) and templates (top panels) under parametric simulation (Strategy 1).