
Figure 2.
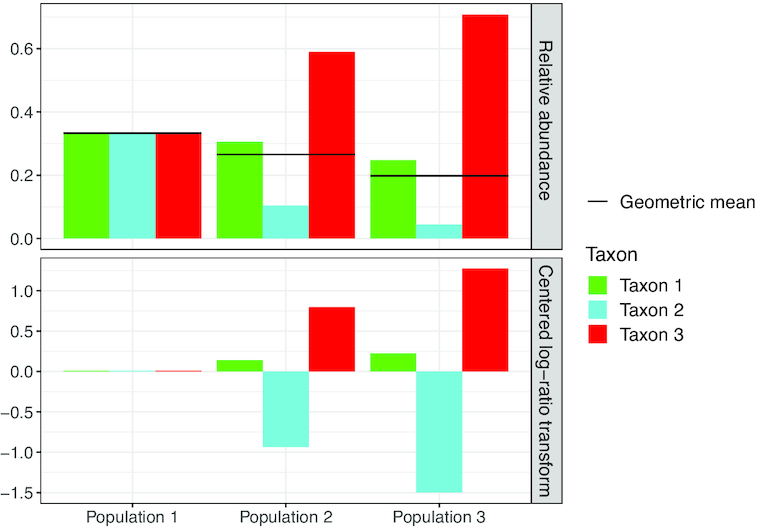
Toy example illustrating the difficulties in interpreting the centered log ratio (clr) transform. In the top panel, three toy populations of three taxa are shown, varying from even on the left to uneven on the right. Horizontal lines represent corresponding geometric means of the relative abundances. The bottom panels shows the clr transforms of these populations. Notice how taxon 1 decreases in abundance from left to right, whilst its clr transform increases, because the geometric mean drops faster than the relative abundance of taxon 1 as the population becomes less even.