Figure 5.

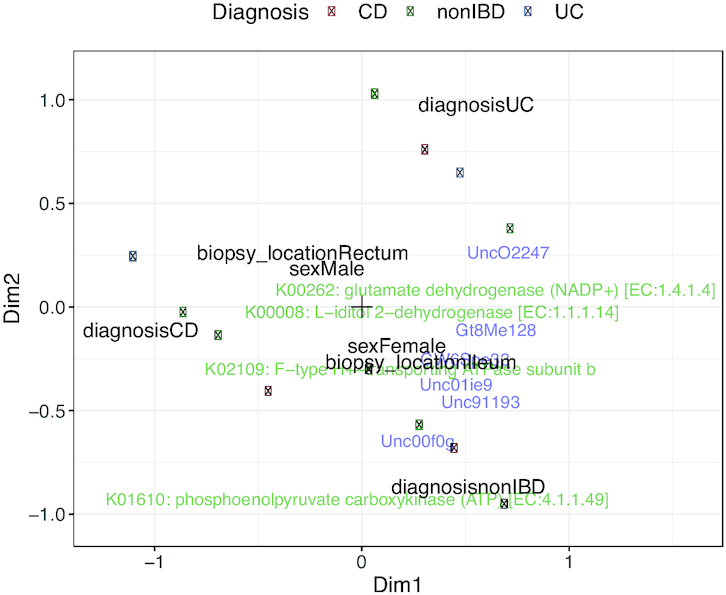
Constrained ordination of the microbiome and proteome datasets from the HMP2 project. Coloured dots represent patients, labels represent features of microbiome (blue) and proteome (green). Black labels represent patient variables.

Constrained ordination of the microbiome and proteome datasets from the HMP2 project. Coloured dots represent patients, labels represent features of microbiome (blue) and proteome (green). Black labels represent patient variables.