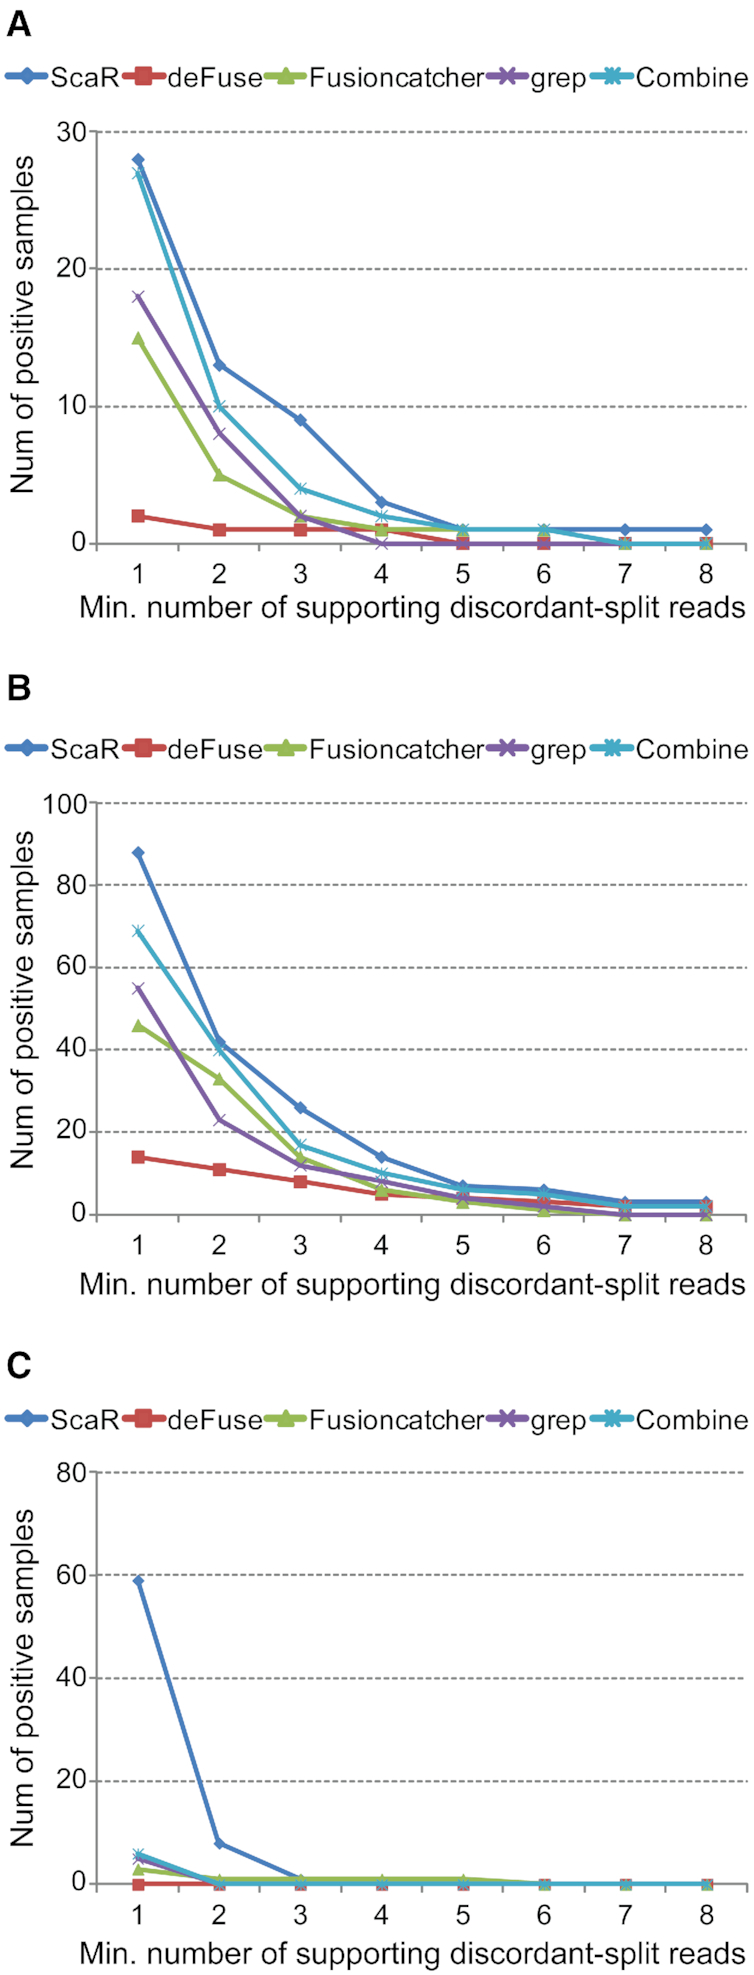
Figure 2.

ScaR performance on TGCT data from TCGA. Comparison of sensitivity between ScaR and other tools (deFuse, FusionCatcher, grep and Combine; combination of the three other tools) for fusion transcripts RCC1-ABHD12B (A), CLEC6A-CLEC4D (B) and RCC1-HENMT1 (C) across 150 TCGA TGCT samples. The X-axes show an increasing threshold of minimum required supporting split reads. The Y-axes show the number of samples with positive detection.
