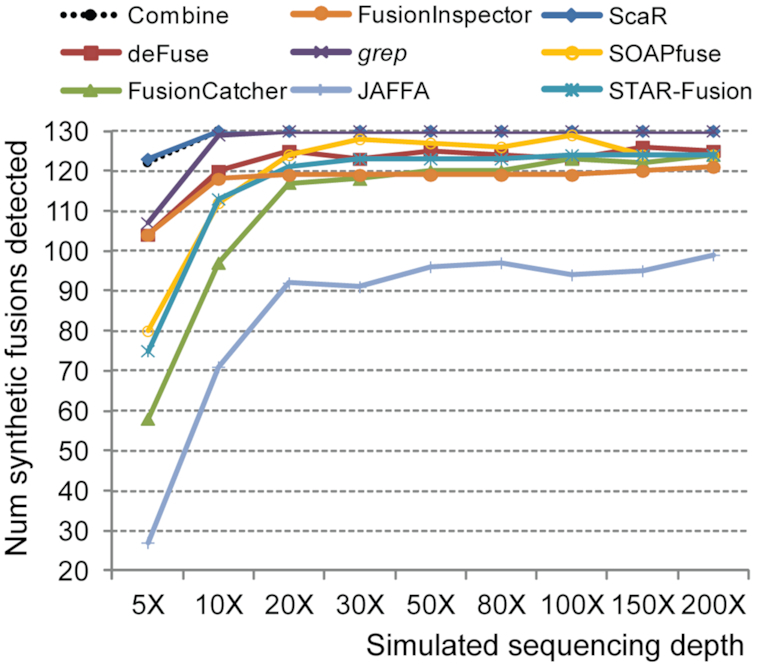
Figure 3.

ScaR performance on simulated data. Benchmarking performance of ScaR, grep and all established fusion finder tools applied on simulated RNA-seq data showing the number of synthetic fusion transcripts detected at simulated coverage levels ranging from 5X to 200X. Combine indicates a union detection by all established fusion tools, including grep.
