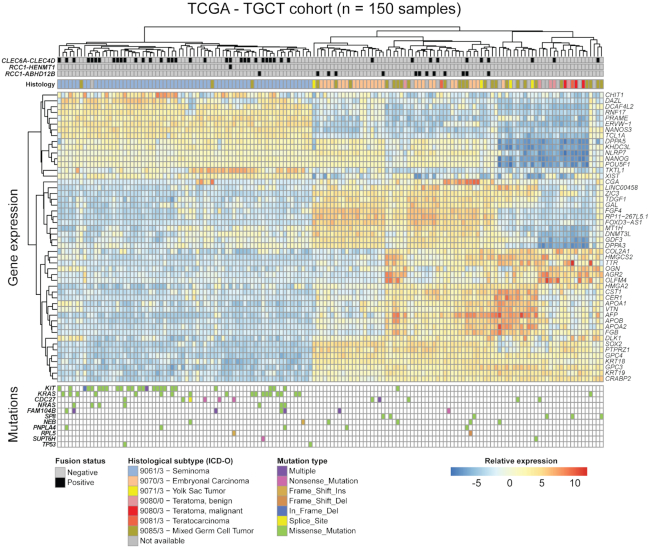
Figure 5.
Fusion transcripts in TGCT and associated molecular features. Heat map showing fusions, somatic mutations and RNA expression (normalized RNA-seq counts) of the 50 most variable genes across the TCGA cohort. Individual samples are clustered along the horizontal axis while genes are clustered on the vertical axis. Annotation tracks include ICD-O histology codes, and fusion transcript status for RCC1-ABHD12B, RCC1-HENMT1 and CLEC6A-CLEC4D. Somatic mutation status for genes known to be recurrently mutated in TGCT are also shown and colored according to mutation type.

